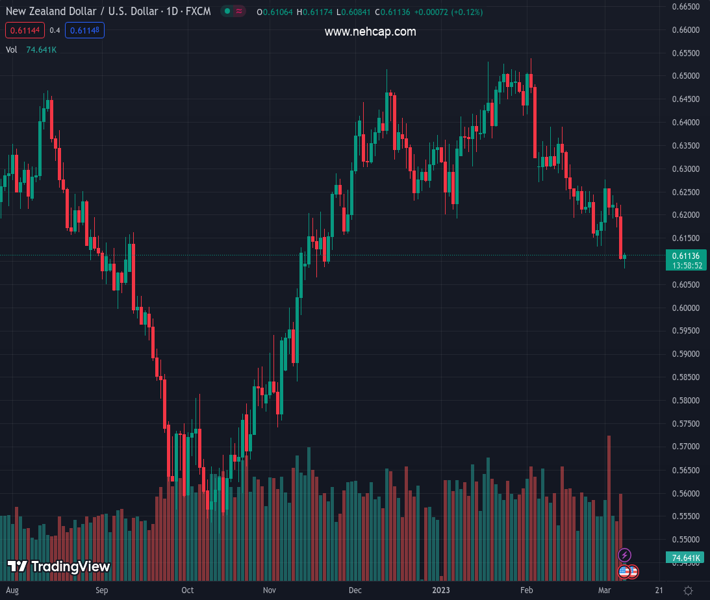
#NZDUSD @ 0.61121 languishes near its lowest level since November amid sustained USD buying. (Pivot Orderbook analysis)
…
This is a premium post.
[s2If !current_user_can(access_s2member_level4)]Please register for PREMIUM VERSION HERE to read full post below containing analysis. In case of any error or you think you are not able to read the full post below, please email us at support#nehcap.com [lwa][/s2If] [s2If current_user_can(access_s2member_level4)]
- NZD/USD languishes near its lowest level since November amid sustained USD buying.
- The USD remains pinned near a multi-month top amid bets for aggressive Fed rate hikes.
- The prevalent risk-off environment further acts as a headwind for the risk-sensitive Kiwi.
The pair currently trades last at 0.61121.
The previous day high was 0.6223 while the previous day low was 0.6103. The daily 38.2% Fib levels comes at 0.6149, expected to provide resistance. Similarly, the daily 61.8% fib level is at 0.6177, expected to provide resistance.
The NZD/USD pair seesaws between tepid gains/minor losses, around the 0.6100 mark through the early European session and consolidates its recent decline to the lowest level since November 17 touched earlier this Wednesday.
The US Dollar builds on the previous day’s blowout rally led by more hawkish remarks by Federal Reserve Chair Jerome Powell and climbs to a fresh multi-month top, which, in turn, is seen acting as a headwind for the NZD/USD pair. Powell surprised investors and raised the possibility of larger rate hikes to tackle sticky inflation. In the prepared remarks for the semi-annual congressional testimony, Powell warned that interest rates might need to go up faster and higher than previously anticipated.
The markets were quick to react and started pricing in a greater chance of a 50 bps lift-off at the March FOMC policy meeting, which remains supportive of elevated US Treasury bond yields. In fact, the yield on the benchmark 10-year US government bond is holding steady near the 4.0% threshold and the rate-sensitive two-year Treasury note stands tall near its highest level since 2007, which, along with a fresh wave of the global risk-aversion trade, continues to lend support to the safe-haven USD.
The market sentiment remains fragile amid worries about economic headwinds stemming from rapidly rising borrowing costs. Adding to this, fading optimism over a strong Chinese economic recovery, along with US-China tensions, temper investors’ appetite for perceived riskier assets. This is evident from a sea of red across the equity markets, which further benefits the Greenback’s status as the global reserve currency and contributes to capping any meaningful upside for the risk-sensitive Kiwi.
That said, the extremely oversold Relative Strength Index (RSI) on hourly charts helps limit losses for the NZD/USD pair, at least for the time being. Nevertheless, the fundamental backdrop seems tilted firmly in favour of bearish traders and suggests that the path of least resistance for spot prices is to the downside. Hence, any attempted recovery move is more likely to get sold into and runs the risk of fizzling out rather quickly. Investors look forward to the US macro data for a fresh impetus.
Wednesday’s US economic docket features the release of the ADP report on private-sector employment and JOLTS Jobs Opening data later during the early North American session. This, along with the US bond yields and Powell’s second day of testimony before the House Financial Services Committee, will drive the USD demand. Apart from this, the broader risk sentiment should influence the NZD/USD pair and allow traders to grab short-term opportunities.
Technical Levels: Supports and Resistances
NZDUSD currently trading at 0.6109 at the time of writing. Pair opened at 0.6114 and is trading with a change of -0.08 % .
| Overview | Overview.1 | |
|---|---|---|
| 0 | Today last price | 0.6109 |
| 1 | Today Daily Change | -0.0005 |
| 2 | Today Daily Change % | -0.0800 |
| 3 | Today daily open | 0.6114 |
The pair remains strongly bearish on the daily time frame. It trades below the 20 SMA @ 0.6243, 50 SMA 0.6332, 100 SMA @ 0.6227 and 200 SMA @ 0.6174.
| Trends | Trends.1 | |
|---|---|---|
| 0 | Daily SMA20 | 0.6243 |
| 1 | Daily SMA50 | 0.6332 |
| 2 | Daily SMA100 | 0.6227 |
| 3 | Daily SMA200 | 0.6174 |
The previous day high was 0.6223 while the previous day low was 0.6103. The daily 38.2% Fib levels comes at 0.6149, expected to provide resistance. Similarly, the daily 61.8% fib level is at 0.6177, expected to provide resistance.
Note the levels of interest below:
- Pivot support is noted at 0.607, 0.6027, 0.595
- Pivot resistance is noted at 0.619, 0.6267, 0.631
| Levels | Levels.1 |
|---|---|
| Previous Daily High | 0.6223 |
| Previous Daily Low | 0.6103 |
| Previous Weekly High | 0.6277 |
| Previous Weekly Low | 0.6131 |
| Previous Monthly High | 0.6538 |
| Previous Monthly Low | 0.6131 |
| Daily Fibonacci 38.2% | 0.6149 |
| Daily Fibonacci 61.8% | 0.6177 |
| Daily Pivot Point S1 | 0.6070 |
| Daily Pivot Point S2 | 0.6027 |
| Daily Pivot Point S3 | 0.5950 |
| Daily Pivot Point R1 | 0.6190 |
| Daily Pivot Point R2 | 0.6267 |
| Daily Pivot Point R3 | 0.6310 |
[/s2If]
Join Our Telegram Group
")


