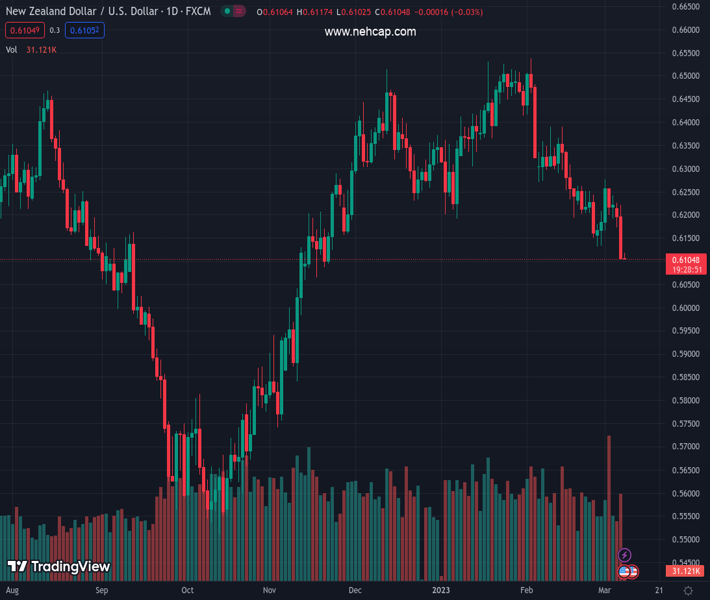
#NZDUSD @ 0.61072 clings to mild losses near the lowest levels since late November 2022. (Pivot Orderbook analysis)
…
This is a premium post.
[s2If !current_user_can(access_s2member_level4)]Please register for PREMIUM VERSION HERE to read full post below containing analysis. In case of any error or you think you are not able to read the full post below, please email us at support#nehcap.com [lwa][/s2If] [s2If current_user_can(access_s2member_level4)]
- NZD/USD clings to mild losses near the lowest levels since late November 2022.
- China-linked news, lack of major data/events allow Kiwi bears to take a breather.
- US ADP Employment Change, Fed Chair Powell’s testimony 2.0 eyed for clear directions.
The pair currently trades last at 0.61072.
The previous day high was 0.6223 while the previous day low was 0.6103. The daily 38.2% Fib levels comes at 0.6149, expected to provide resistance. Similarly, the daily 61.8% fib level is at 0.6177, expected to provide resistance.
NZD/USD stays defensive around the 0.6100 round figure during early Wednesday, following a slump to the lowest levels in more than three months. In doing so, the Kiwi pair portrays the market’s habit of reassessing the previous catalysts amid a light calendar, as well as ahead of the key data/events.
Apart from the price positioning and pre-data anxiety, the Kiwi pair’s latest inaction could also be linked to the risk-positive headlines surrounding China as the US removes testing restrictions on travelers from the dragon nation. However, the hawkish Fed concerns and the fears of the Sino-American tension over the US-Taiwan meeting seem to keep the bears hopeful.
That said, the Kiwi pair marked the biggest daily slump in five weeks the previous day after Federal Reserve (Fed) Chairman Jerome Powell surprised traders on Tuesday by showing readiness for more rate hikes and bolstered the bets of a 50 bps Fed rate hike in March. The policymaker propelled the “higher for longer” Fed rate expectations and bolstered the US Treasury bond yields while weighing on the equities. His comments propelled the yields and the US Dollar while also drowning the commodities and equities and Antipodeans.
It should be noted that the S&P 500 Futures remain indecisive around the 3,992 level after falling the most in two weeks. On the other hand, the difference between the 10-year and two-year US bond coupons marked the deepest yield curve inversion in more than 40 years the previous day, keeping it intact by the press time. That said, the US 10-year Treasury bond yields rose 0.15% while closing around 3.97% on Tuesday but the two-year counterpart gained 2.60% on a day when poking the highest levels since 2007, to 5.02% at the latest.
Moving forward, risk catalysts may entertain NZD/USD traders but major attention will be given to Fed Chair Powell’s second round of testimony and the US ADP Employment Change, the early signal for Friday’s US Nonfarm Payrolls (NFP), for clear directions.
The first daily closing below the 200-DMA in more three months directs NZD/USD towards late November 2022 bottom surrounding 0.6060.
Technical Levels: Supports and Resistances
NZDUSD currently trading at 0.6111 at the time of writing. Pair opened at 0.6114 and is trading with a change of -0.05% % .
| Overview | Overview.1 | |
|---|---|---|
| 0 | Today last price | 0.6111 |
| 1 | Today Daily Change | -0.0003 |
| 2 | Today Daily Change % | -0.05% |
| 3 | Today daily open | 0.6114 |
The pair remains strongly bearish on the daily time frame. It trades below the 20 SMA @ 0.6243, 50 SMA 0.6332, 100 SMA @ 0.6227 and 200 SMA @ 0.6174.
| Trends | Trends.1 | |
|---|---|---|
| 0 | Daily SMA20 | 0.6243 |
| 1 | Daily SMA50 | 0.6332 |
| 2 | Daily SMA100 | 0.6227 |
| 3 | Daily SMA200 | 0.6174 |
The previous day high was 0.6223 while the previous day low was 0.6103. The daily 38.2% Fib levels comes at 0.6149, expected to provide resistance. Similarly, the daily 61.8% fib level is at 0.6177, expected to provide resistance.
Note the levels of interest below:
- Pivot support is noted at 0.607, 0.6027, 0.595
- Pivot resistance is noted at 0.619, 0.6267, 0.631
| Levels | Levels.1 |
|---|---|
| Previous Daily High | 0.6223 |
| Previous Daily Low | 0.6103 |
| Previous Weekly High | 0.6277 |
| Previous Weekly Low | 0.6131 |
| Previous Monthly High | 0.6538 |
| Previous Monthly Low | 0.6131 |
| Daily Fibonacci 38.2% | 0.6149 |
| Daily Fibonacci 61.8% | 0.6177 |
| Daily Pivot Point S1 | 0.6070 |
| Daily Pivot Point S2 | 0.6027 |
| Daily Pivot Point S3 | 0.5950 |
| Daily Pivot Point R1 | 0.6190 |
| Daily Pivot Point R2 | 0.6267 |
| Daily Pivot Point R3 | 0.6310 |
[/s2If]
Join Our Telegram Group
")


