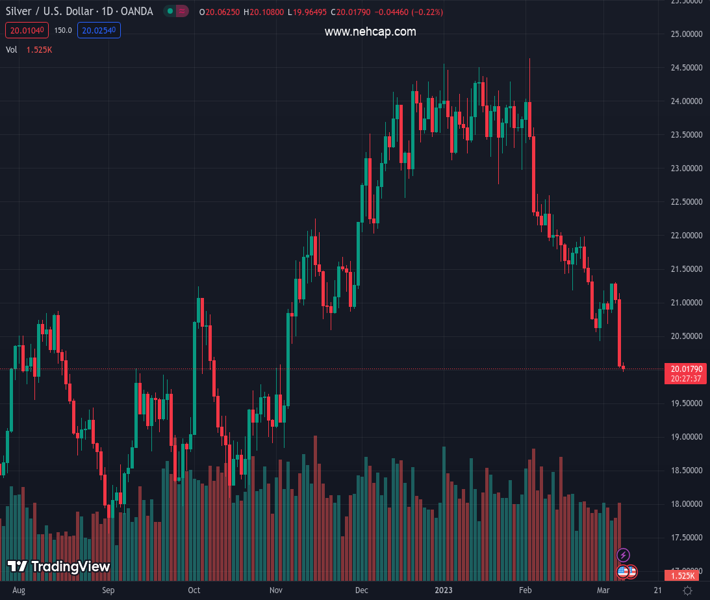
#XAGUSD @ 20.011 Silver price takes offers to refresh multi-day low during three-day downtrend., @nehcap view: Further downside expected (Pivot Orderbook analysis)
…
This is a premium post.
[s2If !current_user_can(access_s2member_level4)]Please register for PREMIUM VERSION HERE to read full post below containing analysis. In case of any error or you think you are not able to read the full post below, please email us at support#nehcap.com [lwa][/s2If] [s2If current_user_can(access_s2member_level4)]
- Silver price takes offers to refresh multi-day low during three-day downtrend.
- Clear break of six-month-old support line, the key Fibonacci retracement level joins bearish MACD signals to favor XAG/USD sellers.
- 200-DMA, monthly resistance line add to the upside filters.
The pair currently trades last at 20.011.
The previous day high was 21.14 while the previous day low was 20.03. The daily 38.2% Fib levels comes at 20.46, expected to provide resistance. Similarly, the daily 61.8% fib level is at 20.72, expected to provide resistance.
Silver price (XAG/USD) remains depressed at the lowest levels in four months as sellers poke the $20.00 psychological magnet to refresh the multi-day low during Wednesday’s Asian session.
In doing so, the bright metal extends the previous day’s downside break of a six-month-old ascending support line, as well as the 61.8% Fibonacci retracement level of the metal’s run-up from September 2022 to February 2023. Adding strength to the downside bias are the bearish MACD signals.
It’s worth noting, however, that the RSI (14) is in the oversold territory and hence multiple supports around $19.80 and $19.60 could restrict short-term XAG/USD declines.
Following that, the 78.6% Fibonacci retracement level surrounding the $19.00 round figure could lure the Silver bears before directing them to the lows marked during the last October and September, respectively near $18.10 and $17.55.
Meanwhile, the 61.8% Fibonacci retracement level, also known as the golden Fibonacci ratio, could restrict short-term XAG/USD recovery at around $20.25 before the support-turned-resistance line from September 2022, close to $20.60 by the press time.
In a case where the Silver price remains firmer past $20.60, the 200-DMA and a one-month-old resistance line, around $21.00 and $21.20, may act as the last defenses of the XAG/USD bears.
Trend: Further downside expected
Technical Levels: Supports and Resistances
XAGUSD currently trading at 20 at the time of writing. Pair opened at 20.08 and is trading with a change of -0.40% % .
| Overview | Overview.1 | |
|---|---|---|
| 0 | Today last price | 20 |
| 1 | Today Daily Change | -0.08 |
| 2 | Today Daily Change % | -0.40% |
| 3 | Today daily open | 20.08 |
The pair remains strongly bearish on the daily time frame. It trades below the 20 SMA @ 21.41, 50 SMA 22.73, 100 SMA @ 22.16 and 200 SMA @ 20.97.
| Trends | Trends.1 | |
|---|---|---|
| 0 | Daily SMA20 | 21.41 |
| 1 | Daily SMA50 | 22.73 |
| 2 | Daily SMA100 | 22.16 |
| 3 | Daily SMA200 | 20.97 |
The previous day high was 21.14 while the previous day low was 20.03. The daily 38.2% Fib levels comes at 20.46, expected to provide resistance. Similarly, the daily 61.8% fib level is at 20.72, expected to provide resistance.
Note the levels of interest below:
- Pivot support is noted at 19.7, 19.31, 18.59
- Pivot resistance is noted at 20.81, 21.53, 21.91
| Levels | Levels.1 |
|---|---|
| Previous Daily High | 21.14 |
| Previous Daily Low | 20.03 |
| Previous Weekly High | 21.27 |
| Previous Weekly Low | 20.42 |
| Previous Monthly High | 24.64 |
| Previous Monthly Low | 20.42 |
| Daily Fibonacci 38.2% | 20.46 |
| Daily Fibonacci 61.8% | 20.72 |
| Daily Pivot Point S1 | 19.70 |
| Daily Pivot Point S2 | 19.31 |
| Daily Pivot Point S3 | 18.59 |
| Daily Pivot Point R1 | 20.81 |
| Daily Pivot Point R2 | 21.53 |
| Daily Pivot Point R3 | 21.91 |
[/s2If]
Join Our Telegram Group
")


