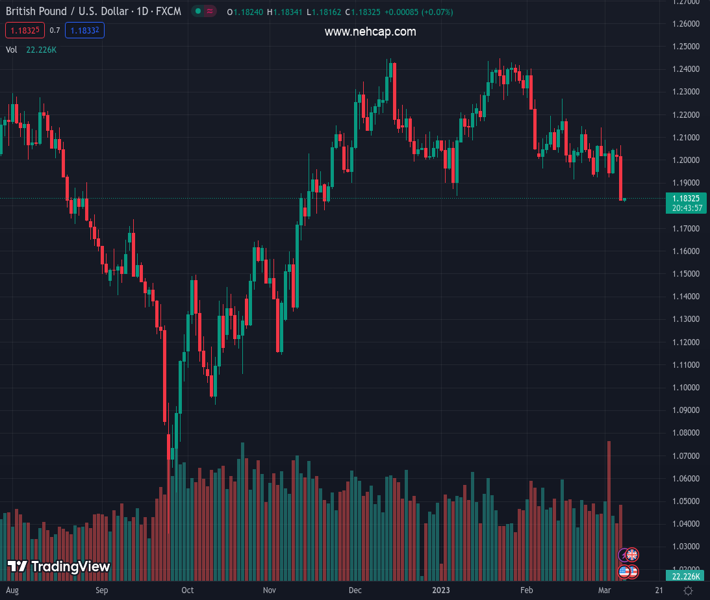
#GBPUSD @ 1.18305 seesaws around multi-day low after falling the most in 11 weeks. (Pivot Orderbook analysis)
…
This is a premium post.
[s2If !current_user_can(access_s2member_level4)]Please register for PREMIUM VERSION HERE to read full post below containing analysis. In case of any error or you think you are not able to read the full post below, please email us at support#nehcap.com [lwa][/s2If] [s2If current_user_can(access_s2member_level4)]
- GBP/USD seesaws around multi-day low after falling the most in 11 weeks.
- Fed Chairman Jerome Powell’s hawkish Testimony, Brexit woes join BoE rate hike concerns to entertain Cable bears.
- The deepest US Treasury bond yield curve inversion in 40 years weigh on GBP/USD.
- Risk catalysts, Powell’s testimony 2.0 and second-tier US data eyed for clear directions.
The pair currently trades last at 1.18305.
The previous day high was 1.2065 while the previous day low was 1.1822. The daily 38.2% Fib levels comes at 1.1915, expected to provide resistance. Similarly, the daily 61.8% fib level is at 1.1972, expected to provide resistance.
GBP/USD struggles to defend the 1.1800 threshold at the lowest levels since late November 2022 even as the market turns dicey during early Wednesday. That said, the mixed plays surrounding Brexit and the Bank of England (BoE) seem to push the Cable pair towards making rounds to 1.1830-20 of late.
“The Bank of England has admitted that Brexit is making the City easier to regulate despite issuing warnings against the Government’s plan to axe swathes of red tape,” said The Telegraph. On the other hand, The Guardian highlights the push the British business leaders use over the UK government to fasten the Brexit practice, which in turn highlights the hopes of an end to the multi-month-old policy deadlock. “Business leaders say frayed relations with the EU are costing the British economy, as suppliers in the bloc grow more cautious about doing business with post-Brexit Britain,” said The Guardian.
Elsewhere, Bank of England (BoE) policymaker Catherine Mann said on Tuesday, “I think more needs to be done with rates.”
Above all, hawkish comments from Federal Reserve (Fed) Chairman Jerome Powell, as well as the widest negative yield differentials between the 10-year and two-year US Treasury bonds, gain major attention the previous day and drowned the GBP/USD price.
It should be noted that Fed’s Powell surprised markets by showing readiness for more rate hikes and bolstered the bets of a 50 bps Fed rate hike in March. The policymaker propelled the “higher for longer” Fed rate expectations and bolstered the US Treasury bond yields while weighing on the equities.
Talking about the yields, the US 10-year Treasury bond yields rose 0.15% while closing around 3.97% on Tuesday but the two-year counterpart gained 2.60% on a day when poking the highest levels since 2007, to 5.02% at the latest. With this, the difference between the 10-year and two-year bond coupons marked the widest yield curve inversion in 40 years and portrays the recession, which in turn underpins the US Dollar’s safe-haven demand and weighs on the GBP/USD pair.
On a different page, the US removal of testing restrictions on travelers from China contrasts with the US-China tussles over Taiwan and Russia to probe the sentiment. Even so, the S&P 500 Futures remain indecisive while waiting for more signals to track Wall Street’s losses.
Looking ahead, a light calendar in the UK may restrict GBP/USD moves after a volatile day. However, Fed Chair Powell’s second round of testimony and the US ADP Employment Change, the early signal for Friday’s US Nonfarm Payrolls (NFP), will be observed more closely for clear directions.
A daily closing below the 200-DMA, around 1.1905 by the press time, directs GBP/USD bears towards the September 2022 peak of 1.1738.
Technical Levels: Supports and Resistances
GBPUSD currently trading at 1.1832 at the time of writing. Pair opened at 1.1828 and is trading with a change of 0.03% % .
| Overview | Overview.1 | |
|---|---|---|
| 0 | Today last price | 1.1832 |
| 1 | Today Daily Change | 0.0004 |
| 2 | Today Daily Change % | 0.03% |
| 3 | Today daily open | 1.1828 |
The pair remains strongly bearish on the daily time frame. It trades below the 20 SMA @ 1.2036, 50 SMA 1.2136, 100 SMA @ 1.1997 and 200 SMA @ 1.1909.
| Trends | Trends.1 | |
|---|---|---|
| 0 | Daily SMA20 | 1.2036 |
| 1 | Daily SMA50 | 1.2136 |
| 2 | Daily SMA100 | 1.1997 |
| 3 | Daily SMA200 | 1.1909 |
The previous day high was 1.2065 while the previous day low was 1.1822. The daily 38.2% Fib levels comes at 1.1915, expected to provide resistance. Similarly, the daily 61.8% fib level is at 1.1972, expected to provide resistance.
Note the levels of interest below:
- Pivot support is noted at 1.1745, 1.1661, 1.1501
- Pivot resistance is noted at 1.1988, 1.2148, 1.2231
| Levels | Levels.1 |
|---|---|
| Previous Daily High | 1.2065 |
| Previous Daily Low | 1.1822 |
| Previous Weekly High | 1.2143 |
| Previous Weekly Low | 1.1922 |
| Previous Monthly High | 1.2402 |
| Previous Monthly Low | 1.1915 |
| Daily Fibonacci 38.2% | 1.1915 |
| Daily Fibonacci 61.8% | 1.1972 |
| Daily Pivot Point S1 | 1.1745 |
| Daily Pivot Point S2 | 1.1661 |
| Daily Pivot Point S3 | 1.1501 |
| Daily Pivot Point R1 | 1.1988 |
| Daily Pivot Point R2 | 1.2148 |
| Daily Pivot Point R3 | 1.2231 |
[/s2If]
Join Our Telegram Group
")


