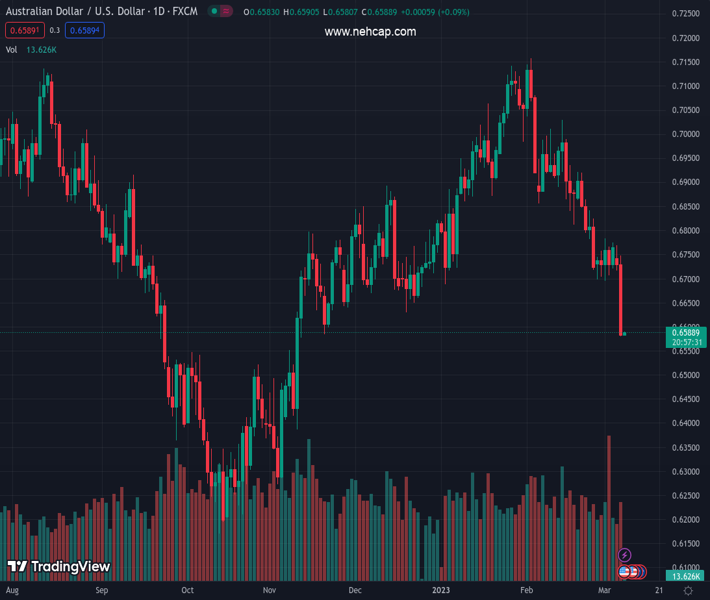
#AUDUSD @ 0.65893 remains depressed at the lowest levels in four months., @nehcap view: Limited downside expected (Pivot Orderbook analysis)
…
This is a premium post.
[s2If !current_user_can(access_s2member_level4)]Please register for PREMIUM VERSION HERE to read full post below containing analysis. In case of any error or you think you are not able to read the full post below, please email us at support#nehcap.com [lwa][/s2If] [s2If current_user_can(access_s2member_level4)]
- AUD/USD remains depressed at the lowest levels in four months.
- Clear downside break of previous support line from February, bearish MACD signals favor Aussie pair sellers.
- 61.8% Fibonacci retracement level, five-month-old horizontal support zone join oversold RSI (14) to challenge bears.
- AUD/USD recovery remains elusive below 0.6780-85 resistance confluence.
The pair currently trades last at 0.65893.
The previous day high was 0.6748 while the previous day low was 0.6581. The daily 38.2% Fib levels comes at 0.6645, expected to provide resistance. Similarly, the daily 61.8% fib level is at 0.6684, expected to provide resistance.
AUD/USD bears keep the reins at a four-month low, making rounds to 0.6580-90 during early Wednesday, following the biggest daily slump in a month.
That said, a clear downside break of a one-month-old descending trend line joins the bearish MACD signals to keep the Aussie sellers in the driver’s seat even if the latest inaction probes the downside momentum. On the same line could be the oversold conditions of the RSI (14) line.
Even so, the AUD/USD prices remain on their way to hitting the next key support area, namely the 0.6540-20 region comprising the 61.8% Fibonacci retracement level of October 2022 to February 2023 upside and multiple levels marked in the last five months.
It’s worth noting that the Aussie pair’s weakness past 0.6520 could aim for the last September’s low surrounding 0.6360 and may witness multiple supports near 0.6350-40 before highlighting the late 2022 bottom of around 0.6170.
Alternatively, the support-turned-resistance line from early February, close to 0.6630 by the press time, precedes the 50% Fibonacci retracement level of 0.6665 to cap the short-term upside of the AUD/USD pair.
Following that, a one-month-old descending resistance line near 0.6720 could lure the pair buyers.
However, a convergence of the 200-DMA and 38.2% Fibonacci retracement, near 0.6780-85, appears a tough nut to crack for the AUD/USD bulls.
Trend: Limited downside expected
Technical Levels: Supports and Resistances
AUDUSD currently trading at 0.6587 at the time of writing. Pair opened at 0.6592 and is trading with a change of -0.08% % .
| Overview | Overview.1 | |
|---|---|---|
| 0 | Today last price | 0.6587 |
| 1 | Today Daily Change | -0.0005 |
| 2 | Today Daily Change % | -0.08% |
| 3 | Today daily open | 0.6592 |
The pair remains strongly bearish on the daily time frame. It trades below the 20 SMA @ 0.6828, 50 SMA 0.6896, 100 SMA @ 0.6757 and 200 SMA @ 0.6787.
| Trends | Trends.1 | |
|---|---|---|
| 0 | Daily SMA20 | 0.6828 |
| 1 | Daily SMA50 | 0.6896 |
| 2 | Daily SMA100 | 0.6757 |
| 3 | Daily SMA200 | 0.6787 |
The previous day high was 0.6748 while the previous day low was 0.6581. The daily 38.2% Fib levels comes at 0.6645, expected to provide resistance. Similarly, the daily 61.8% fib level is at 0.6684, expected to provide resistance.
Note the levels of interest below:
- Pivot support is noted at 0.6533, 0.6474, 0.6366
- Pivot resistance is noted at 0.6699, 0.6807, 0.6866
| Levels | Levels.1 |
|---|---|
| Previous Daily High | 0.6748 |
| Previous Daily Low | 0.6581 |
| Previous Weekly High | 0.6784 |
| Previous Weekly Low | 0.6695 |
| Previous Monthly High | 0.7158 |
| Previous Monthly Low | 0.6698 |
| Daily Fibonacci 38.2% | 0.6645 |
| Daily Fibonacci 61.8% | 0.6684 |
| Daily Pivot Point S1 | 0.6533 |
| Daily Pivot Point S2 | 0.6474 |
| Daily Pivot Point S3 | 0.6366 |
| Daily Pivot Point R1 | 0.6699 |
| Daily Pivot Point R2 | 0.6807 |
| Daily Pivot Point R3 | 0.6866 |
[/s2If]
Join Our Telegram Group
")


