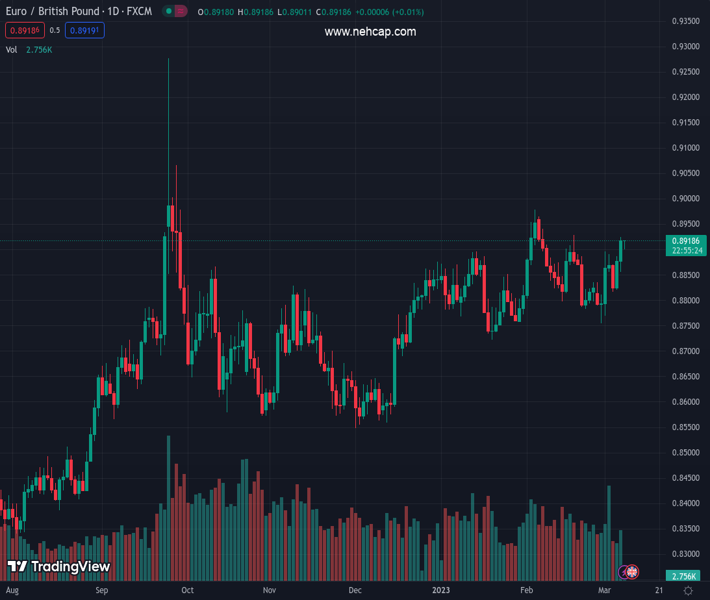
#EURGBP @ 0.89170 climbed above 0.8900 and a one-month-old downslope trendline. (Pivot Orderbook analysis)
…
This is a premium post.
[s2If !current_user_can(access_s2member_level4)]Please register for PREMIUM VERSION HERE to read full post below containing analysis. In case of any error or you think you are not able to read the full post below, please email us at support#nehcap.com [lwa][/s2If] [s2If current_user_can(access_s2member_level4)]
- EUR/GBP climbed above 0.8900 and a one-month-old downslope trendline.
- EUR/GBP Price Analysis: Upward biased, at the brisk of cracking 0.9000.
The pair currently trades last at 0.89170.
The previous day high was 0.8887 while the previous day low was 0.8827. The daily 38.2% Fib levels comes at 0.8864, expected to provide support. Similarly, the daily 61.8% fib level is at 0.885, expected to provide support.
The EUR/GBP soars past the 0.8900 psychological price level, hitting a three-week high of 0.8925. However, buyers could not lift the exchange rate towards the YTD high at 0.8978 but held to solid gains of 1.06%. At the time of writing, the EUR/GBP is trading at 0.6918.
The EUR/GBP rallied on the back of fundamental news from the United States (US). The US Federal Reserve (Fed) Chair Jerome Powell commented that rates would peak higher than foreseen and added larger size hikes are back in the table.
Therefore, the EUR/GBP rallied above a one-month-old resistance trendline, which, once cleared, opened the door towards 0.8900. For a bullish continuation, the EUR/GBP must claim the February 17 high of 0.8928. Once cleared, the EUR/GBP next stop would be the YTD high at 0.8978 before testing the 0.9000 area.
As an alternate scenario, the EUR/GBP first support would be 0.8920, followed by the 0.8900 figure. Once the EUR/GBP clears that area, the cross could dive towards the 20-day EMA at 0.8854.
Technical Levels: Supports and Resistances
EURGBP currently trading at 0.8918 at the time of writing. Pair opened at 0.8884 and is trading with a change of 0.38 % .
| Overview | Overview.1 | |
|---|---|---|
| 0 | Today last price | 0.8918 |
| 1 | Today Daily Change | 0.0034 |
| 2 | Today Daily Change % | 0.3800 |
| 3 | Today daily open | 0.8884 |
The pair remains strongly bullish on the daily timeframe. It trades above its 20 SMA @ 0.885, 50 SMA 0.8837, 100 SMA @ 0.8759 and 200 SMA @ 0.8671.
| Trends | Trends.1 | |
|---|---|---|
| 0 | Daily SMA20 | 0.8850 |
| 1 | Daily SMA50 | 0.8837 |
| 2 | Daily SMA100 | 0.8759 |
| 3 | Daily SMA200 | 0.8671 |
The previous day high was 0.8887 while the previous day low was 0.8827. The daily 38.2% Fib levels comes at 0.8864, expected to provide support. Similarly, the daily 61.8% fib level is at 0.885, expected to provide support.
Note the levels of interest below:
- Pivot support is noted at 0.8845, 0.8805, 0.8784
- Pivot resistance is noted at 0.8905, 0.8927, 0.8966
| Levels | Levels.1 |
|---|---|
| Previous Daily High | 0.8887 |
| Previous Daily Low | 0.8827 |
| Previous Weekly High | 0.8897 |
| Previous Weekly Low | 0.8755 |
| Previous Monthly High | 0.8979 |
| Previous Monthly Low | 0.8755 |
| Daily Fibonacci 38.2% | 0.8864 |
| Daily Fibonacci 61.8% | 0.8850 |
| Daily Pivot Point S1 | 0.8845 |
| Daily Pivot Point S2 | 0.8805 |
| Daily Pivot Point S3 | 0.8784 |
| Daily Pivot Point R1 | 0.8905 |
| Daily Pivot Point R2 | 0.8927 |
| Daily Pivot Point R3 | 0.8966 |
[/s2If]
Join Our Telegram Group
")


