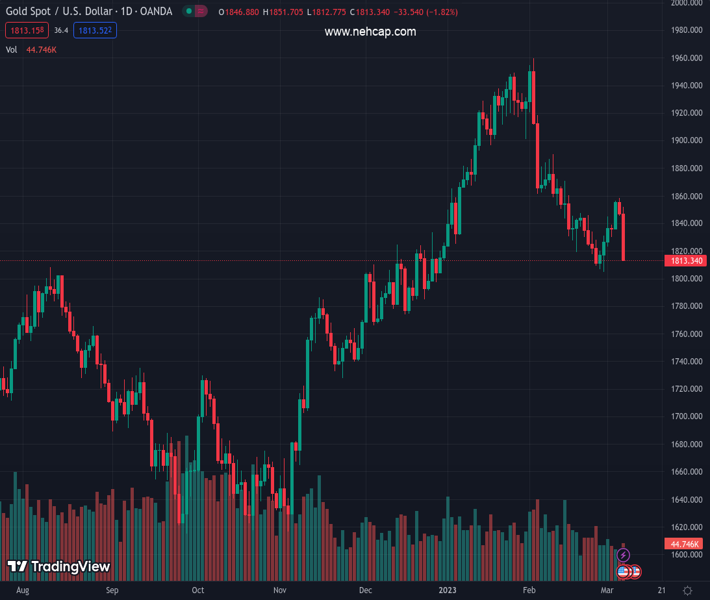
#XAUUSD @ 1,813.08 Gold price has been dumped by investors on extremely hawkish Fed Powell’s commentary. (Pivot Orderbook analysis)
…
This is a premium post.
[s2If !current_user_can(access_s2member_level4)]Please register for PREMIUM VERSION HERE to read full post below containing analysis. In case of any error or you think you are not able to read the full post below, please email us at support#nehcap.com [lwa][/s2If] [s2If current_user_can(access_s2member_level4)]
- Gold price has been dumped by investors on extremely hawkish Fed Powell’s commentary.
- S&P500 plummeted on Tuesday as more rates from the Fed confirm a United States recession.
- Gold price looks set to re-test an eight-day low at $1,804.00 amid a dismal market mood.
The pair currently trades last at 1813.08.
The previous day high was 1858.35 while the previous day low was 1845.18. The daily 38.2% Fib levels comes at 1850.21, expected to provide resistance. Similarly, the daily 61.8% fib level is at 1853.32, expected to provide resistance.
Gold price (XAU/USD) has witnessed an intense sell-off from the market participants as Federal Reserve (Fed) chair Jerome Powell, in his testimony before Congress, has confirmed that the central bank is prepared for more rates than previously anticipated. Considering the fact that consumer spending is resilient and the labor market is extremely tight, the Fed has no other option than to make monetary tools more restrictive.
S&P500 plummeted on Tuesday as more rates from the Fed confirm a United States recession, portraying a dismal market mood. The US Dollar Index (DXY) received exceptionally high bids as investors underpinned the risk-aversion theme. The USD Index has refreshed its three-month high at 105.65. The 10-year US Treasury yields have failed to catch the 4.0% resistance despite the extremely hawkish stance from Fed chair Jerome Powell.
This was the first commentary from Fed Powell after a less-than-anticipated decline in US Consumer Price Index and unusual solid payroll data for January. It shows that fears of persistent inflation are certain and the Fed is ready to gear up the terminal rate ahead. As per the CME FedWatch tool, the chances of 50 basis points (bps) rate hike have scaled above 70%.
For further guidance, US Automatic Data Processing (ADP) Employment Change (Feb) will remain in focus. According to the estimates, the US economy has added fresh payrolls by 200K in the labor market, higher than the former release of 106K.
Gold price is declining towards the eight-day low support placed from February 28 low at $1,804.70. A break below the same would drag it further toward the horizontal support plotted from December 15 low at $1,773.90. The mighty 200-period Exponential Moving Average (EMA) at $1,850.88 has acted as a major barricade for the Gold bulls.
Tuesday’s sell-off in the Gold price has pushed the Relative Strength Index (RSI) (14) into the bearish range of 20.00-40.00, which indicates more weakness ahead.
Technical Levels: Supports and Resistances
XAUUSD currently trading at 1813.48 at the time of writing. Pair opened at 1846.69 and is trading with a change of -1.8 % .
| Overview | Overview.1 | |
|---|---|---|
| 0 | Today last price | 1813.48 |
| 1 | Today Daily Change | -33.21 |
| 2 | Today Daily Change % | -1.80 |
| 3 | Today daily open | 1846.69 |
The pair is trading below its 20 Daily moving average @ 1842.61, below its 50 Daily moving average @ 1869.61 , above its 100 Daily moving average @ 1802.84 and above its 200 Daily moving average @ 1775.44
| Trends | Trends.1 | |
|---|---|---|
| 0 | Daily SMA20 | 1842.61 |
| 1 | Daily SMA50 | 1869.61 |
| 2 | Daily SMA100 | 1802.84 |
| 3 | Daily SMA200 | 1775.44 |
The previous day high was 1858.35 while the previous day low was 1845.18. The daily 38.2% Fib levels comes at 1850.21, expected to provide resistance. Similarly, the daily 61.8% fib level is at 1853.32, expected to provide resistance.
Note the levels of interest below:
- Pivot support is noted at 1841.8, 1836.9, 1828.63
- Pivot resistance is noted at 1854.97, 1863.24, 1868.14
| Levels | Levels.1 |
|---|---|
| Previous Daily High | 1858.35 |
| Previous Daily Low | 1845.18 |
| Previous Weekly High | 1856.35 |
| Previous Weekly Low | 1804.76 |
| Previous Monthly High | 1959.80 |
| Previous Monthly Low | 1804.76 |
| Daily Fibonacci 38.2% | 1850.21 |
| Daily Fibonacci 61.8% | 1853.32 |
| Daily Pivot Point S1 | 1841.80 |
| Daily Pivot Point S2 | 1836.90 |
| Daily Pivot Point S3 | 1828.63 |
| Daily Pivot Point R1 | 1854.97 |
| Daily Pivot Point R2 | 1863.24 |
| Daily Pivot Point R3 | 1868.14 |
[/s2If]
Join Our Telegram Group
")


