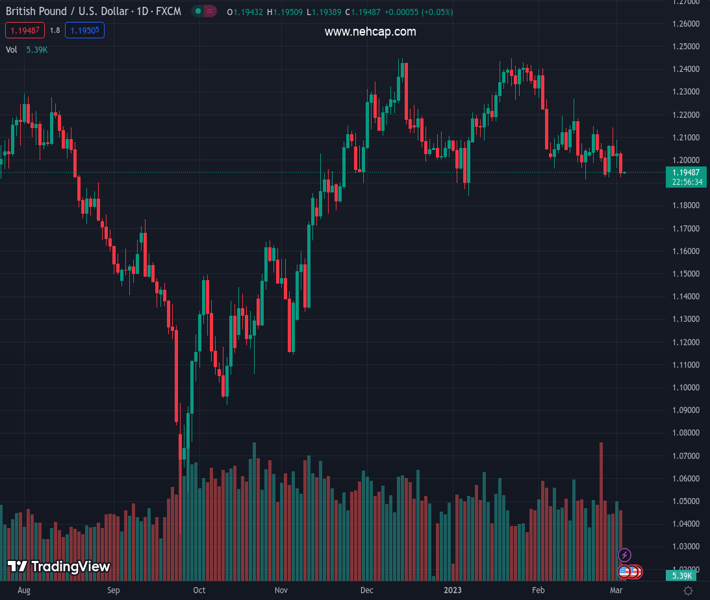
#GBPUSD @ 1.19504 pair has dropped to near weekly low around 1.1922 despite easing risk-off mood. (Pivot Orderbook analysis)
…
This is a premium post.
[s2If !current_user_can(access_s2member_level4)]Please register for PREMIUM VERSION HERE to read full post below containing analysis. In case of any error or you think you are not able to read the full post below, please email us at support#nehcap.com [lwa][/s2If] [s2If current_user_can(access_s2member_level4)]
- GBP/USD pair has dropped to near weekly low around 1.1922 despite easing risk-off mood.
- Consideration of policy slowdown or a pause in the policy tightening spell by the BoE could push Sterling on the back foot.
- The Cable is hovering near the horizontal support of the Descending Triangle plotted from 1.1920.
The pair currently trades last at 1.19504.
The previous day high was 1.209 while the previous day low was 1.1965. The daily 38.2% Fib levels comes at 1.2013, expected to provide resistance. Similarly, the daily 61.8% fib level is at 1.2042, expected to provide resistance.
The GBP/USD pair has dropped to near weekly low around 1.1922 in the early Asian session. The Cable is expected to be dumped by the market participants as the street is anticipating a pause or a deceleration in the pace of interest rate hiking by the Bank of England (BoE) despite the fact that the United Kingdom inflation is still trending in the double-digit figure.
Analysts at Commerzbank are of the view that “Bailey is not really committing very firmly to further strong tightening measures. In view of an inflation rate in double-digits, I would have hoped for more commitment toward rate hikes. But obviously, the BoE is not willing to inflict (further) harm on the economy and the population to get a grip of inflation.”
Meanwhile, the market sentiment looks positive as risk-sensitive assets like S&P500 has shown a decent recovery on Thursday. The US Dollar Index (DXY) is struggling to recapture the 105.00 resistance as the risk aversion theme is fading gradually.
GBP/USD is auctioning near the horizontal support of the Descending Triangle chart pattern plotted from February 17 low around 1.1920 on a four-hour scale. The downward-sloping trendline of the aforementioned chart pattern is placed from the February high at 1.2402.
The 100-period Exponential Moving Average (EMA) at 1.2060 will act as a major barricade for the Pound Sterling.
Meanwhile, the Relative Strength Index (RSI) (14) has slipped below 40.00 from the 40.00-60.00 range, indicating that the bearish momentum could be triggered.
A confident break below February 17 low at 1.1915 will drag the Cable firmly towards January 5 low at 1.1875 followed by the round-level support at 1.1800.
On the contrary, a move above February 24 high at 1.2040 will drive the asset towards February 23 high around 1.2080. A breach of the latter will expose the asset to February 21 high of around 1.2140.
Technical Levels: Supports and Resistances
GBPUSD currently trading at 1.1953 at the time of writing. Pair opened at 1.2019 and is trading with a change of -0.55 % .
| Overview | Overview.1 | |
|---|---|---|
| 0 | Today last price | 1.1953 |
| 1 | Today Daily Change | -0.0066 |
| 2 | Today Daily Change % | -0.5500 |
| 3 | Today daily open | 1.2019 |
The pair is trading below its 20 Daily moving average @ 1.2062, below its 50 Daily moving average @ 1.2143 , below its 100 Daily moving average @ 1.197 and above its 200 Daily moving average @ 1.1923
| Trends | Trends.1 | |
|---|---|---|
| 0 | Daily SMA20 | 1.2062 |
| 1 | Daily SMA50 | 1.2143 |
| 2 | Daily SMA100 | 1.1970 |
| 3 | Daily SMA200 | 1.1923 |
The previous day high was 1.209 while the previous day low was 1.1965. The daily 38.2% Fib levels comes at 1.2013, expected to provide resistance. Similarly, the daily 61.8% fib level is at 1.2042, expected to provide resistance.
Note the levels of interest below:
- Pivot support is noted at 1.1959, 1.19, 1.1835
- Pivot resistance is noted at 1.2084, 1.2149, 1.2208
| Levels | Levels.1 |
|---|---|
| Previous Daily High | 1.2090 |
| Previous Daily Low | 1.1965 |
| Previous Weekly High | 1.2148 |
| Previous Weekly Low | 1.1928 |
| Previous Monthly High | 1.2402 |
| Previous Monthly Low | 1.1915 |
| Daily Fibonacci 38.2% | 1.2013 |
| Daily Fibonacci 61.8% | 1.2042 |
| Daily Pivot Point S1 | 1.1959 |
| Daily Pivot Point S2 | 1.1900 |
| Daily Pivot Point S3 | 1.1835 |
| Daily Pivot Point R1 | 1.2084 |
| Daily Pivot Point R2 | 1.2149 |
| Daily Pivot Point R3 | 1.2208 |
[/s2If]
Join Our Telegram Group


