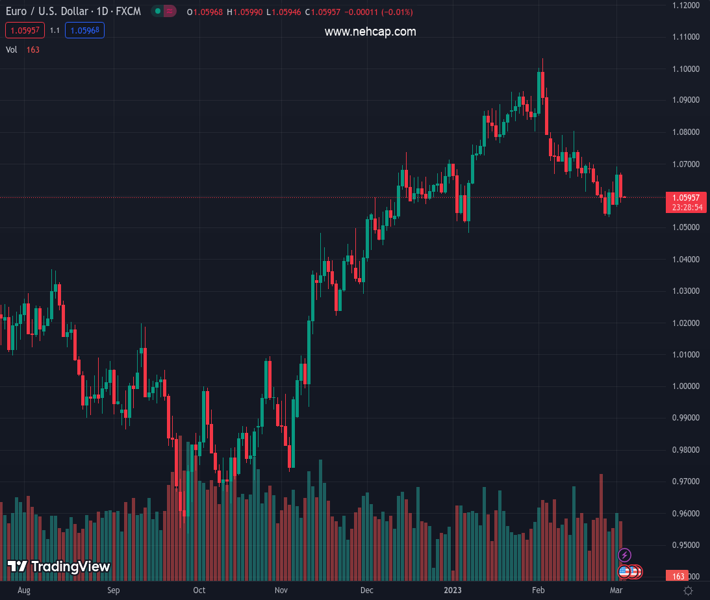
#EURUSD @ 1.05960 holds lower ground after falling the most on a day in one month. (Pivot Orderbook analysis)
…
This is a premium post.
[s2If !current_user_can(access_s2member_level4)]Please register for PREMIUM VERSION HERE to read full post below containing analysis. In case of any error or you think you are not able to read the full post below, please email us at support#nehcap.com [lwa][/s2If] [s2If current_user_can(access_s2member_level4)]
- EUR/USD holds lower ground after falling the most on a day in one month.
- US data, ECB/Fed talks and EU figures all hint at higher rates to battle inflation woes.
- Light calendar, macro could restrict market moves ahead of US ISM Services PMI.
- Next week’s Fed Chair Powell’s testimony, US NFP are crucial.
The pair currently trades last at 1.05960.
The previous day high was 1.0692 while the previous day low was 1.0565. The daily 38.2% Fib levels comes at 1.0643, expected to provide resistance. Similarly, the daily 61.8% fib level is at 1.0614, expected to provide resistance.
EUR/USD treads water around 1.0600, after posting the biggest daily loss in a month, as traders await more clues amid the battle between the hawks of the European Central Bank (ECB) and the Federal Reserve (Fed). That said, the quote dropped heavily the previous day but couldn’t rule out the weekly gains amid the US Dollar’s limited capacity to win the bids, despite strong US Treasury bond yields and hawkish Fed commentary. With this, the Euro pair remains sidelined during the initial hour of Friday’s Asian session after pausing the bears around 1.0575 a few minutes back.
On Thursday, United States Treasury bond yields rallied multi-month high amid escalating fears of inflation and higher rates from major central banks, mainly from the Fed. The same allowed the US Dollar to post the biggest daily jump since early February. However, late Thursday’s comments from Federal Reserve Bank of Atlanta President Raphael Bostic joined the cautious mood ahead of the US ISM Services PMI for February to probe the greenback bulls afterward.
The benchmark US 10-year Treasury bond yields rose to a fresh high since early November 2022 while piercing the 4.0% threshold whereas the two-year counterpart rallied to the highest levels since 2007 to 4.94%. It should be noted that the strong yields initially weighed on the US equities but the comments from Fed’s Bostic allowed Wall Street to close on a positive side.
Fed’s Bostic said on Thursday that the central bank could be in position to pause the current tightening cycle by mid to late summer. On the other hand, Boston Fed President Susan Collins said on Thursday that more rate hikes are required to bring inflation back in control. She added that the extent of interest rate hikes will be determined by incoming data.
Other than the hawkish Fed, US data suggesting a tight labor market and higher wage costs also underpinned the inflation woes and helped the US Dollar to remain firm. On Thursday, US Jobless Claims dropped to 190K during the week ended on February 24 versus 195K market forecasts and 192K prior. Further, Nonfarm Productivity for the fourth quarter (Q4) eased to 1.7% from 3.0% prior and 2.6% market forecasts while the Unit Labor Costs jumped 3.6% versus 1.6% analysts’ estimations and 1.1% previous readings.
In the case of the Eurozone, the latest accounts of the ECB February policy meeting were published on Thursday and stated, “Governing Council members agreed that further increases in key rates are required for policy to enter restrictive territory,” reported Reuters.
On the same line, European Central Bank (ECB) President Christine Lagarde, said in an interview with Spanish TV on Thursday that the case for a 50 bps rate hike this month is still on the table as inflation is still too high.
Talking about the data, the annualized Eurozone Harmonised Index of Consumer Prices (HICP) came in a tad lower to 8.5% in February versus 8.6% prior and 8.2% market forecasts. However, the Core HICP grew 5.6% during the said month when compared to 5.3% analysts’ expectations and previous reading. The monthly figures were quite impressive as the headline HICP jumped by 0.8% in February vs. -0.3% expectations and -0.2% previous while the core HICP arrived at 0.8% last month as against the 0% expected and -0.8% registered in January.
Looking ahead, EUR/USD traders should pay attention to the second-readings of the Eurozone and German activity numbers ahead of the US ISM Services PMI for February, expected 54.5 versus 55.2. It’s worth noting that the stated PMI allowed the US Dollar to rally the previous month after it gained support from the strong US Nonfarm Payrolls (NFP), up for publication in the next week.
Also read: ISM Services PMI Preview: Strong figure set to catapult US Dollar to new highs
EUR/USD wobbles within a 130 pip trading range comprising a convergence of the 50-day and 21-day Exponential Moving Average (EMA), around 1.0660-65, as well as the 200-day EMA support surrounding 1.0535.
Technical Levels: Supports and Resistances
EURUSD currently trading at 1.0597 at the time of writing. Pair opened at 1.0665 and is trading with a change of -0.64% % .
| Overview | Overview.1 | |
|---|---|---|
| 0 | Today last price | 1.0597 |
| 1 | Today Daily Change | -0.0068 |
| 2 | Today Daily Change % | -0.64% |
| 3 | Today daily open | 1.0665 |
The pair is trading below its 20 Daily moving average @ 1.0687, below its 50 Daily moving average @ 1.0726 , above its 100 Daily moving average @ 1.0478 and above its 200 Daily moving average @ 1.033
| Trends | Trends.1 | |
|---|---|---|
| 0 | Daily SMA20 | 1.0687 |
| 1 | Daily SMA50 | 1.0726 |
| 2 | Daily SMA100 | 1.0478 |
| 3 | Daily SMA200 | 1.0330 |
The previous day high was 1.0692 while the previous day low was 1.0565. The daily 38.2% Fib levels comes at 1.0643, expected to provide resistance. Similarly, the daily 61.8% fib level is at 1.0614, expected to provide resistance.
Note the levels of interest below:
- Pivot support is noted at 1.059, 1.0515, 1.0464
- Pivot resistance is noted at 1.0716, 1.0767, 1.0842
| Levels | Levels.1 |
|---|---|
| Previous Daily High | 1.0692 |
| Previous Daily Low | 1.0565 |
| Previous Weekly High | 1.0705 |
| Previous Weekly Low | 1.0536 |
| Previous Monthly High | 1.1033 |
| Previous Monthly Low | 1.0533 |
| Daily Fibonacci 38.2% | 1.0643 |
| Daily Fibonacci 61.8% | 1.0614 |
| Daily Pivot Point S1 | 1.0590 |
| Daily Pivot Point S2 | 1.0515 |
| Daily Pivot Point S3 | 1.0464 |
| Daily Pivot Point R1 | 1.0716 |
| Daily Pivot Point R2 | 1.0767 |
| Daily Pivot Point R3 | 1.0842 |
[/s2If]
Join Our Telegram Group


