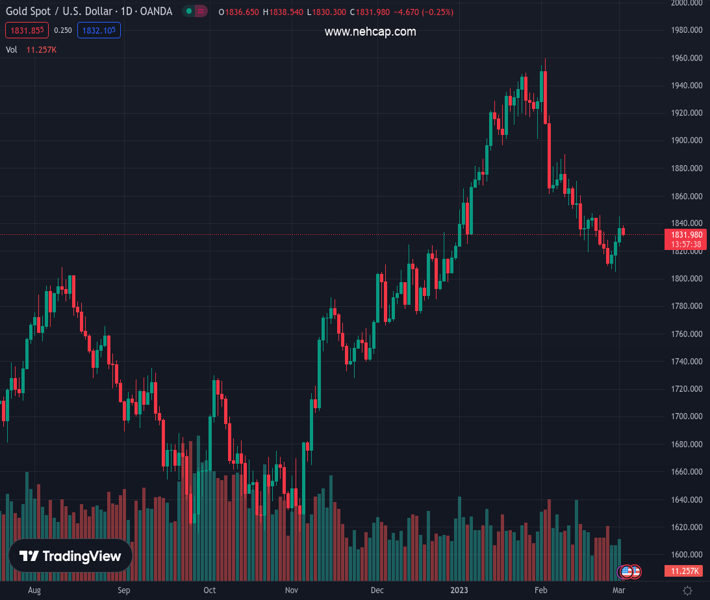
#XAUUSD @ 1,831.28 Gold price edges lower on Thursday and snaps a three-day winning streak to a one-week high. (Pivot Orderbook analysis)
…
This is a premium post.
[s2If !current_user_can(access_s2member_level4)]Please register for PREMIUM VERSION HERE to read full post below containing analysis. In case of any error or you think you are not able to read the full post below, please email us at support#nehcap.com [lwa][/s2If] [s2If current_user_can(access_s2member_level4)]
- Gold price edges lower on Thursday and snaps a three-day winning streak to a one-week high.
- Resurgent US Dollar demand, rising US bond yields and hawkish Federal Reserve exerts pressure.
- Looming recession risks could lend some support to the XAU/USD and help limit further losses.
The pair currently trades last at 1831.28.
The previous day high was 1844.69 while the previous day low was 1823.12. The daily 38.2% Fib levels comes at 1836.45, expected to provide resistance. Similarly, the daily 61.8% fib level is at 1831.36, expected to provide resistance.
Gold price comes under some selling pressure on Thursday and stalls this week’s recovery move from the $1,805-$1,804 region, or its lowest level since December 23. The XAU/USD remains depressed around the $1,830 area through the early European session and for now, seems to have snapped a three-day winning streak to a one-week high touched on Wednesday.
The US Dollar (USD) regains positive traction and reverses a part of the previous day’s sharp retracement slide from a multi-week high. This, in turn, is seen as a key factor exerting some downward pressure on the US Dollar-denominated Gold price. The markets seem convinced that the Federal Reserve (Fed) will keep interest rates higher for longer in the wake of stubbornly high inflation in the United States (US). The bets were reaffirmed by the overnight hawkish remarks by Fed officials., which continue to underpin the Greenback.
In fact, Atlanta Fed President Raphael Bostic maintained the view the policy rate needs to rise to the 5.00%-5.25% range and remain at that level well into 2024. Adding to this, Minneapolis Fed President Neel Kashkari reiterated that inflation in the US is still very high and that their job is to bring it down. Karikari also noted that the risk of under-tightening is greater than the risk of over-tightening. This remains supportive of the ongoing move up in the US Treasury bond yields higher and contributes to driving flows away from the non-yielding Gold price.
Investors, meanwhile, remain worried about economic headwinds stemming from rapidly rising borrowing costs. This, in turn, keeps a lid on the overnight optimism led by the upbeat Chinese PMI prints and could offer some support to the safe-haven Gold price. Hence, it will be prudent to wait for strong follow-through selling before positioning for the resumption of the recent downfall witnessed over the past month or so. Traders now look to the release of the US Weekly Initial Jobless Claims data for some impetus later during the early North American session.
From a technical perspective, the overnight swing high, around the $1,844 area, now seems to act as an immediate hurdle. Some follow-through buying has the potential to lift Gold price further towards the 50-day Simple Moving Average (SMA), currently pegged around the $1,866 region. The latter should act as a pivotal point, which if cleared decisively will set the stage for a further near-term appreciating move.
On the flip side, any subsequent decline might now find some support near the $1.822-$1,821 region ahead of the $1,810 level and the weekly low, around the $1,805-$1,804 zone. This is closely followed by the $1,800 round-figure mark and the 100-day SMA, currently around the $1,795 area. A convincing break below the said support levels will be seen as a fresh trigger for bearish traders and make Gold prices vulnerable to slide further.
Technical Levels: Supports and Resistances
XAUUSD currently trading at 1831.51 at the time of writing. Pair opened at 1837.34 and is trading with a change of -0.32 % .
| Overview | Overview.1 | |
|---|---|---|
| 0 | Today last price | 1831.51 |
| 1 | Today Daily Change | -5.83 |
| 2 | Today Daily Change % | -0.32 |
| 3 | Today daily open | 1837.34 |
The pair is trading below its 20 Daily moving average @ 1848.01, below its 50 Daily moving average @ 1866.6 , above its 100 Daily moving average @ 1797.08 and above its 200 Daily moving average @ 1775.55
| Trends | Trends.1 | |
|---|---|---|
| 0 | Daily SMA20 | 1848.01 |
| 1 | Daily SMA50 | 1866.60 |
| 2 | Daily SMA100 | 1797.08 |
| 3 | Daily SMA200 | 1775.55 |
The previous day high was 1844.69 while the previous day low was 1823.12. The daily 38.2% Fib levels comes at 1836.45, expected to provide resistance. Similarly, the daily 61.8% fib level is at 1831.36, expected to provide resistance.
Note the levels of interest below:
- Pivot support is noted at 1825.41, 1813.48, 1803.84
- Pivot resistance is noted at 1846.98, 1856.62, 1868.55
| Levels | Levels.1 |
|---|---|
| Previous Daily High | 1844.69 |
| Previous Daily Low | 1823.12 |
| Previous Weekly High | 1847.59 |
| Previous Weekly Low | 1808.99 |
| Previous Monthly High | 1959.80 |
| Previous Monthly Low | 1804.76 |
| Daily Fibonacci 38.2% | 1836.45 |
| Daily Fibonacci 61.8% | 1831.36 |
| Daily Pivot Point S1 | 1825.41 |
| Daily Pivot Point S2 | 1813.48 |
| Daily Pivot Point S3 | 1803.84 |
| Daily Pivot Point R1 | 1846.98 |
| Daily Pivot Point R2 | 1856.62 |
| Daily Pivot Point R3 | 1868.55 |
[/s2If]
Join Our Telegram Group
")


