#AUDUSD @ 0.67390 takes offers to extend pullback from late February., @nehcap view: Limited downside expected (Pivot Orderbook analysis)
…
This is a premium post.
[s2If !current_user_can(access_s2member_level4)]Please register for PREMIUM VERSION HERE to read full post below containing analysis. In case of any error or you think you are not able to read the full post below, please email us at support#nehcap.com [lwa][/s2If] [s2If current_user_can(access_s2member_level4)]
- AUD/USD takes offers to extend pullback from late February.
- Previous resistance line, weekly horizontal support can challenge Aussie pair bears amid descending RSI towards oversold territory.
- U-turn from immediate upside hurdle, bearish MACD signals keep sellers hopeful; bulls need validation from 200-HMA.
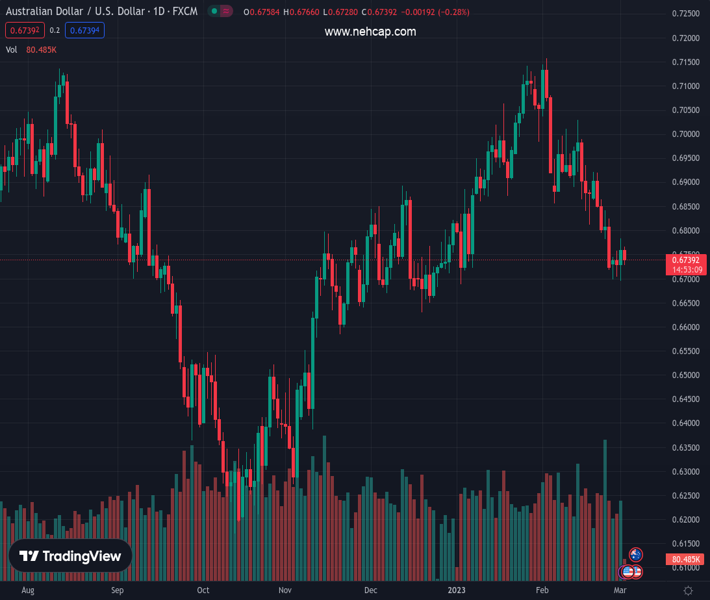
The pair currently trades last at 0.67390.
The previous day high was 0.6784 while the previous day low was 0.6695. The daily 38.2% Fib levels comes at 0.675, expected to provide resistance. Similarly, the daily 61.8% fib level is at 0.6729, expected to provide support.
AUD/USD holds lower grounds near the intraday bottom surrounding 0.6730, reversing the previous day’s gains heading into Thursday’s European session.
In doing so, the Aussie pair extends the previous day’s pullback from the February 23 swing low amid bearish MACD signals.
Adding strength to the downside bias is the lower-high formation since late Wednesday, as well as the quote’s sustained trading below the 200-Hour Moving Average (HMA).
Amid these plays, the AUD/USD pair is all set for further downside.
However, a convergence of the previous resistance line from February 20 and a horizontal area comprising the lows marked so far during the current week, around the 0.6700 round figure, appears a tough nut to crack for the sellers.
Not only the stated support confluence but the RSI (14) line also challenges the Aussie pair’s further downside by speedily dropping towards the oversold territory.
In a case where the AUD/USD remains bearish past 0.6700, a quick fall toward December 2022 low surrounding 0.6630 can’t be ruled out.
On the flip side, a successful break of the aforementioned horizontal resistance near 0.6785 guards the AUD/USD pair’s immediate upside. Following that, the 200-HMA level of near 0.6800 may act as the last defense of the bears.
Trend: Limited downside expected
Technical Levels: Supports and Resistances
AUDUSD currently trading at 0.6732 at the time of writing. Pair opened at 0.6754 and is trading with a change of -0.33% % .
| Overview | Overview.1 | |
|---|---|---|
| 0 | Today last price | 0.6732 |
| 1 | Today Daily Change | -0.0022 |
| 2 | Today Daily Change % | -0.33% |
| 3 | Today daily open | 0.6754 |
The pair remains strongly bearish on the daily time frame. It trades below the 20 SMA @ 0.6879, 50 SMA 0.6896, 100 SMA @ 0.6739 and 200 SMA @ 0.6796.
| Trends | Trends.1 | |
|---|---|---|
| 0 | Daily SMA20 | 0.6879 |
| 1 | Daily SMA50 | 0.6896 |
| 2 | Daily SMA100 | 0.6739 |
| 3 | Daily SMA200 | 0.6796 |
The previous day high was 0.6784 while the previous day low was 0.6695. The daily 38.2% Fib levels comes at 0.675, expected to provide resistance. Similarly, the daily 61.8% fib level is at 0.6729, expected to provide support.
Note the levels of interest below:
- Pivot support is noted at 0.6705, 0.6656, 0.6617
- Pivot resistance is noted at 0.6794, 0.6833, 0.6882
| Levels | Levels.1 |
|---|---|
| Previous Daily High | 0.6784 |
| Previous Daily Low | 0.6695 |
| Previous Weekly High | 0.6921 |
| Previous Weekly Low | 0.6719 |
| Previous Monthly High | 0.7158 |
| Previous Monthly Low | 0.6698 |
| Daily Fibonacci 38.2% | 0.6750 |
| Daily Fibonacci 61.8% | 0.6729 |
| Daily Pivot Point S1 | 0.6705 |
| Daily Pivot Point S2 | 0.6656 |
| Daily Pivot Point S3 | 0.6617 |
| Daily Pivot Point R1 | 0.6794 |
| Daily Pivot Point R2 | 0.6833 |
| Daily Pivot Point R3 | 0.6882 |
[/s2If]
Join Our Telegram Group
")


