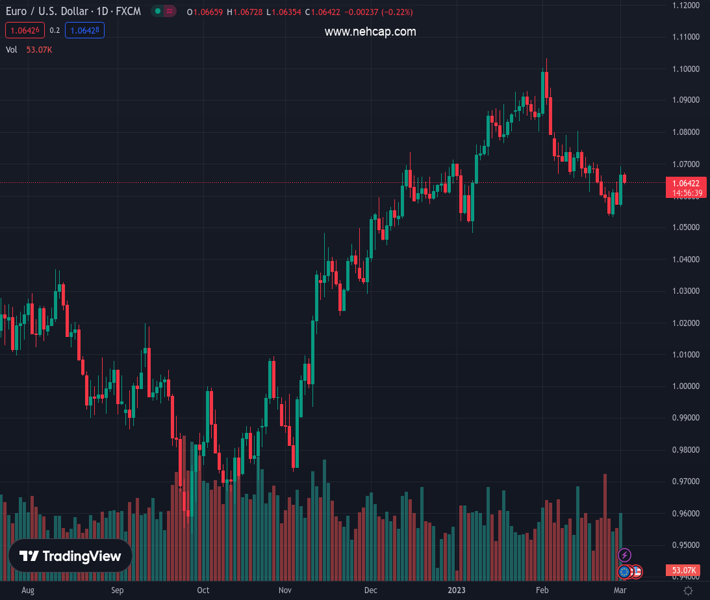
#EURUSD @ 1.06422 extends pullback from one-week high, pares the biggest daily gains in a month. (Pivot Orderbook analysis)
…
This is a premium post.
[s2If !current_user_can(access_s2member_level4)]Please register for PREMIUM VERSION HERE to read full post below containing analysis. In case of any error or you think you are not able to read the full post below, please email us at support#nehcap.com [lwa][/s2If] [s2If current_user_can(access_s2member_level4)]
- EUR/USD extends pullback from one-week high, pares the biggest daily gains in a month.
- Strong US Treasury bond yields join risk-negative headlines to renew US Dollar demand.
- Upbeat German inflation, hawkish ECB rhetoric puts a floor under the Euro price.
- Flash readings of Eurozone HICP and CPI will precede ECB President Lagarde’s speech to entertain EUR/USD traders.
The pair currently trades last at 1.06422.
The previous day high was 1.0692 while the previous day low was 1.0565. The daily 38.2% Fib levels comes at 1.0643, expected to provide resistance. Similarly, the daily 61.8% fib level is at 1.0614, expected to provide support.
EUR/USD prints mild losses around intraday low of 1.0635 as it pares the biggest daily gain in a month while reversing from the one-week high during early Thursday. In doing so, the major currency pair justifies the broad US Dollar strength ahead of the key Eurozone inflation numbers and a speech from the European Central Bank (ECB) President Christine Lagarde.
That said, US Dollar Index (DXY) extends the bounce off a one-week low to 104.70 at the latest, up 0.27% intraday, as the hawkish bias of the major central bank officials joins inflation fears to propel the yields.
Also adding strength to the US Dollar could be the upbeat details of the US ISM Manufacturing PMI for February. On the contrary, Germany’s Inflation number, per the Consumer Price Index (CPI), stayed unchanged at 8.7% YoY for February versus 8.5% expected. However, the annual Harmonised Index of Consumer Prices (HICP), the ECB’s preferred gauge of inflation, edged higher to 9.3% from 9.2% in January, compared to analysts’ estimate of 9%.
On Wednesday, Minneapolis Federal Reserve (Fed) President Neel Kashkari reiterated his previous calls for higher interest rates while citing the fears emanating from the services inflation. On the same line, ECB Governing Council member Madis Muller said, “Rate hikes are having an effect but inflation is still too high.” Further, ECB policymakers Joachim Nagel and Francois Villeroy de Galhau also highlighted the inflation fears to suggest the need for higher rates.
It should be noted that the fading optimism over China’s economic growth recently joined the fears of the Sino-American tussles and exerted additional downside pressure on the EUR/USD prices.
Against this backdrop, the US 10-year Treasury bond yields rose to the highest levels since early November 2022 by piercing the 4.0% mark, around 4.02% at the latest, whereas the two-year counterpart rallied to the highest levels since June 2007 by flashing the 4.92% mark by the press time. The jump in the US Treasury bond yields portrays the market’s fears, which in turn probed bulls on Wall Street and weigh on S&P 500 Futures as of late.
Looking ahead, the first readings of February’s Eurozone Consumer Price Index (CPI) and the ECB’s preferred inflation gauge, namely HICP, will be crucial for the EUR/USD traders to watch for clear directions. Additionally, ECB President Lagarde’s speech also appears crucial for the near-term guide.
Also read: Eurozone Inflation Preview: Eyes on monthly HICP amid heightened hawkish ECB bets
Failure to provide a daily closing beyond the 50-day Exponential Moving Average (EMA), currently around 1.0660, triggers EUR/USD pullback towards the 200-day EMA retest, close to 1.0535 at the latest.
Technical Levels: Supports and Resistances
EURUSD currently trading at 1.0642 at the time of writing. Pair opened at 1.0665 and is trading with a change of -0.22% % .
| Overview | Overview.1 | |
|---|---|---|
| 0 | Today last price | 1.0642 |
| 1 | Today Daily Change | -0.0023 |
| 2 | Today Daily Change % | -0.22% |
| 3 | Today daily open | 1.0665 |
The pair is trading below its 20 Daily moving average @ 1.0687, below its 50 Daily moving average @ 1.0726 , above its 100 Daily moving average @ 1.0478 and above its 200 Daily moving average @ 1.033
| Trends | Trends.1 | |
|---|---|---|
| 0 | Daily SMA20 | 1.0687 |
| 1 | Daily SMA50 | 1.0726 |
| 2 | Daily SMA100 | 1.0478 |
| 3 | Daily SMA200 | 1.0330 |
The previous day high was 1.0692 while the previous day low was 1.0565. The daily 38.2% Fib levels comes at 1.0643, expected to provide resistance. Similarly, the daily 61.8% fib level is at 1.0614, expected to provide support.
Note the levels of interest below:
- Pivot support is noted at 1.059, 1.0515, 1.0464
- Pivot resistance is noted at 1.0716, 1.0767, 1.0842
| Levels | Levels.1 |
|---|---|
| Previous Daily High | 1.0692 |
| Previous Daily Low | 1.0565 |
| Previous Weekly High | 1.0705 |
| Previous Weekly Low | 1.0536 |
| Previous Monthly High | 1.1033 |
| Previous Monthly Low | 1.0533 |
| Daily Fibonacci 38.2% | 1.0643 |
| Daily Fibonacci 61.8% | 1.0614 |
| Daily Pivot Point S1 | 1.0590 |
| Daily Pivot Point S2 | 1.0515 |
| Daily Pivot Point S3 | 1.0464 |
| Daily Pivot Point R1 | 1.0716 |
| Daily Pivot Point R2 | 1.0767 |
| Daily Pivot Point R3 | 1.0842 |
[/s2If]
Join Our Telegram Group
")


