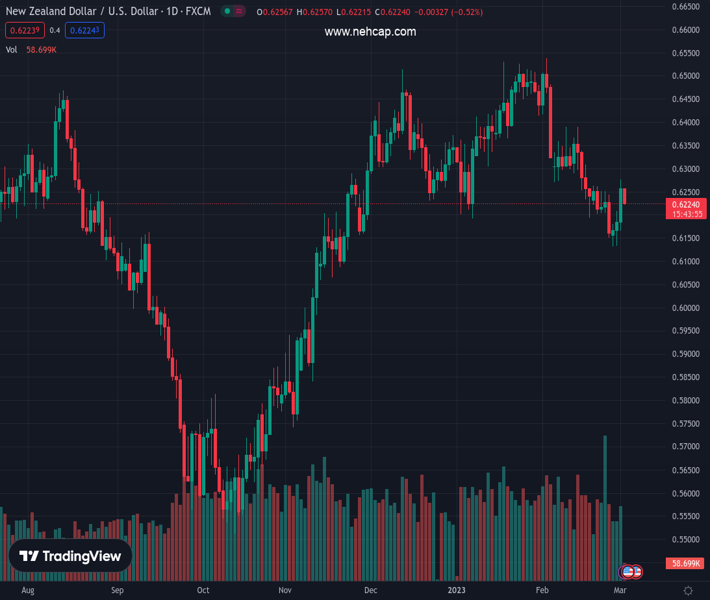
#NZDUSD @ 0.62227 has printed a fresh day low at 0.6222 amid the risk-off mood. (Pivot Orderbook analysis)
…
This is a premium post.
[s2If !current_user_can(access_s2member_level4)]Please register for PREMIUM VERSION HERE to read full post below containing analysis. In case of any error or you think you are not able to read the full post below, please email us at support#nehcap.com [lwa][/s2If] [s2If current_user_can(access_s2member_level4)]
- NZD/USD has printed a fresh day low at 0.6222 amid the risk-off mood.
- A mean reversion to near 50-EMA is offering a bargain buy to investors.
- The RSI (14) is expected to find a cushion around 40.00.
The pair currently trades last at 0.62227.
The previous day high was 0.6277 while the previous day low was 0.6166. The daily 38.2% Fib levels comes at 0.6235, expected to provide resistance. Similarly, the daily 61.8% fib level is at 0.6208, expected to provide support.
The NZD/USD pair has refreshed its day low at 0.6222 in the early European session. The Kiwi asset has sensed pressure and soaring US yields have dampened the market mood. The 10-year US Treasury yields have jumped to near 4.03% and are showing no signs of exhaustion yet.
S&P500 futures have tumbled in the Asian session as investors are worried about the recession situation in the United States economy, considering the fact that the Federal Reserve (Fed) will push rates above 5% and will keep them steady beyond 2023. The US Dollar Index (DXY) has refreshed its day high at 104.34 amid the risk-off market mood.
NZD/USD has corrected to near the 50-period Exponential Moving Average (EMA) at around 0.6223 after failing to extend its bullish reversal above the horizontal resistance placed from February 21 high at 0.6263 on an hourly scale.
A scrutiny of the Relative Strength Index (RSI) (14) indicates that the momentum oscillator has already delivered a bullish reversal. The oscillation range of the RSI (14) has already shifted to 40.00-80.00. Therefore, the momentum indicator is expected to find a cushion at 40.00.
The Kiwi asset is offering a buying opportunity near the 50-EMA at 0.6223, which could push the major toward March 1 high at 0.6276 followed by the round-level resistance at 0.6300.
In an alternate scenario, a breakdown of January 6 low at 0.6193 will drag the asset toward November 28 low at 0.6155. A slippage below the latter will expose the asset for more downside toward the round-level support at 0.6100.
Technical Levels: Supports and Resistances
NZDUSD currently trading at 0.6227 at the time of writing. Pair opened at 0.6253 and is trading with a change of -0.42 % .
| Overview | Overview.1 | |
|---|---|---|
| 0 | Today last price | 0.6227 |
| 1 | Today Daily Change | -0.0026 |
| 2 | Today Daily Change % | -0.4200 |
| 3 | Today daily open | 0.6253 |
The pair is trading below its 20 Daily moving average @ 0.6277, below its 50 Daily moving average @ 0.634 , above its 100 Daily moving average @ 0.6205 and above its 200 Daily moving average @ 0.618
| Trends | Trends.1 | |
|---|---|---|
| 0 | Daily SMA20 | 0.6277 |
| 1 | Daily SMA50 | 0.6340 |
| 2 | Daily SMA100 | 0.6205 |
| 3 | Daily SMA200 | 0.6180 |
The previous day high was 0.6277 while the previous day low was 0.6166. The daily 38.2% Fib levels comes at 0.6235, expected to provide resistance. Similarly, the daily 61.8% fib level is at 0.6208, expected to provide support.
Note the levels of interest below:
- Pivot support is noted at 0.6187, 0.6121, 0.6076
- Pivot resistance is noted at 0.6298, 0.6343, 0.6409
| Levels | Levels.1 |
|---|---|
| Previous Daily High | 0.6277 |
| Previous Daily Low | 0.6166 |
| Previous Weekly High | 0.6263 |
| Previous Weekly Low | 0.6151 |
| Previous Monthly High | 0.6538 |
| Previous Monthly Low | 0.6131 |
| Daily Fibonacci 38.2% | 0.6235 |
| Daily Fibonacci 61.8% | 0.6208 |
| Daily Pivot Point S1 | 0.6187 |
| Daily Pivot Point S2 | 0.6121 |
| Daily Pivot Point S3 | 0.6076 |
| Daily Pivot Point R1 | 0.6298 |
| Daily Pivot Point R2 | 0.6343 |
| Daily Pivot Point R3 | 0.6409 |
[/s2If]
Join Our Telegram Group
")


