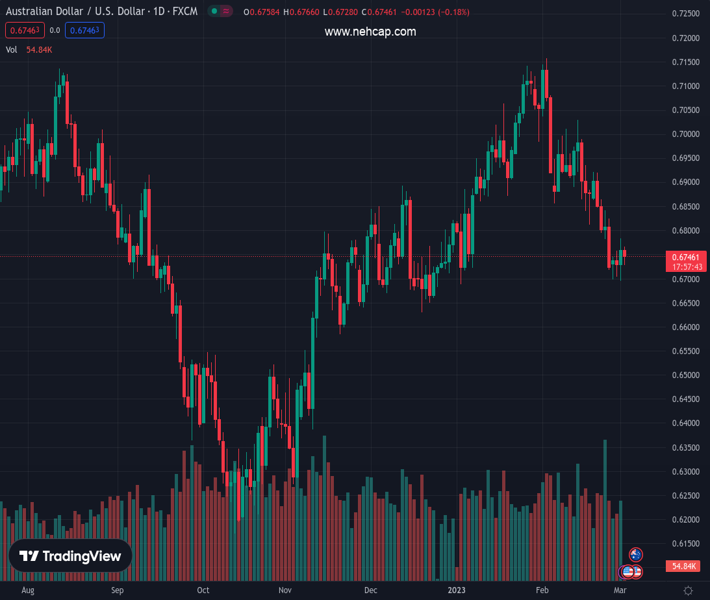
#AUDUSD @ 0.67456 is putting efforts into defending the 0.6730 support despite a dismal market mood. (Pivot Orderbook analysis)
…
This is a premium post.
[s2If !current_user_can(access_s2member_level4)]Please register for PREMIUM VERSION HERE to read full post below containing analysis. In case of any error or you think you are not able to read the full post below, please email us at support#nehcap.com [lwa][/s2If] [s2If current_user_can(access_s2member_level4)]
- AUD/USD is putting efforts into defending the 0.6730 support despite a dismal market mood.
- The 10-year US Treasury yields have printed a fresh three-month high of 4.02%.
- Upbeat US Manufacturing New Orders Index data is fueling US Treasury yields.
The pair currently trades last at 0.67456.
The previous day high was 0.6784 while the previous day low was 0.6695. The daily 38.2% Fib levels comes at 0.675, expected to provide resistance. Similarly, the daily 61.8% fib level is at 0.6729, expected to provide support.
The AUD/USD pair has demonstrated a buying interest after dropping to near 0.6730 in the Asian session. The Aussie asset is expected to turn sideways as wild movements are generally followed by volatility contraction. Also, the capped upside in the US Dollar Index (DXY) is restricting range extension in the Aussie asset.
Market mood is displaying caution as investors are worried that more rates from the Federal Reserve (Fed) will push the United States economy into a recession. S&P500 futures have incurred more losses, carry-forwarding weak Wednesday’s session. Investor shave underpinned the risk aversion theme whose impact is clearly visible on the US government bonds. The 10-year US Treasury yields are constantly refreshing their three-month high as the Fed is set to push interest rates by 5% by summer.
At the press time, the 10-year US Treasury yields have printed a high of 4.02%. However, the USD Index is struggling to find direction after weak US Manufacturing PMI data.
On Wednesday, the US ISM reported a surprise decline in the Manufacturing PMI figures. The economic data contracted consecutively for the fourth time, landed at 47.7, lower than the consensus of 48.0 but higher than the former release of 47.4.
The catalyst that is supporting yields is the Manufacturing New Orders Index data, which indicates robust forward demand and could fuel inflationary pressures. The economic data jumped strongly to 47.0 from the expectations of 43.7 and the former release of 42.5, portraying a bright outlook.
Meanwhile, a sheer decline in the monthly Australian monthly Consumer Price Index (CPI) is expected to restrict the Australian Dollar to the downside. The monthly CPI (Jan) dropped significantly to 7.4% from the expectations of 8.0% and the prior release of 8.4%. A mammoth decline in the inflation data mush has provided a big relief to Reserve Bank of Australia (RBA) policymakers. Also, a decline in the Gross Domestic Product (GDP) (Q4) was a cherry on the cake.
Technical Levels: Supports and Resistances
AUDUSD currently trading at 0.6743 at the time of writing. Pair opened at 0.6754 and is trading with a change of -0.16 % .
| Overview | Overview.1 | |
|---|---|---|
| 0 | Today last price | 0.6743 |
| 1 | Today Daily Change | -0.0011 |
| 2 | Today Daily Change % | -0.1600 |
| 3 | Today daily open | 0.6754 |
The pair is trading below its 20 Daily moving average @ 0.6879, below its 50 Daily moving average @ 0.6896 , above its 100 Daily moving average @ 0.6739 and below its 200 Daily moving average @ 0.6796
| Trends | Trends.1 | |
|---|---|---|
| 0 | Daily SMA20 | 0.6879 |
| 1 | Daily SMA50 | 0.6896 |
| 2 | Daily SMA100 | 0.6739 |
| 3 | Daily SMA200 | 0.6796 |
The previous day high was 0.6784 while the previous day low was 0.6695. The daily 38.2% Fib levels comes at 0.675, expected to provide resistance. Similarly, the daily 61.8% fib level is at 0.6729, expected to provide support.
Note the levels of interest below:
- Pivot support is noted at 0.6705, 0.6656, 0.6617
- Pivot resistance is noted at 0.6794, 0.6833, 0.6882
| Levels | Levels.1 |
|---|---|
| Previous Daily High | 0.6784 |
| Previous Daily Low | 0.6695 |
| Previous Weekly High | 0.6921 |
| Previous Weekly Low | 0.6719 |
| Previous Monthly High | 0.7158 |
| Previous Monthly Low | 0.6698 |
| Daily Fibonacci 38.2% | 0.6750 |
| Daily Fibonacci 61.8% | 0.6729 |
| Daily Pivot Point S1 | 0.6705 |
| Daily Pivot Point S2 | 0.6656 |
| Daily Pivot Point S3 | 0.6617 |
| Daily Pivot Point R1 | 0.6794 |
| Daily Pivot Point R2 | 0.6833 |
| Daily Pivot Point R3 | 0.6882 |
[/s2If]
Join Our Telegram Group


