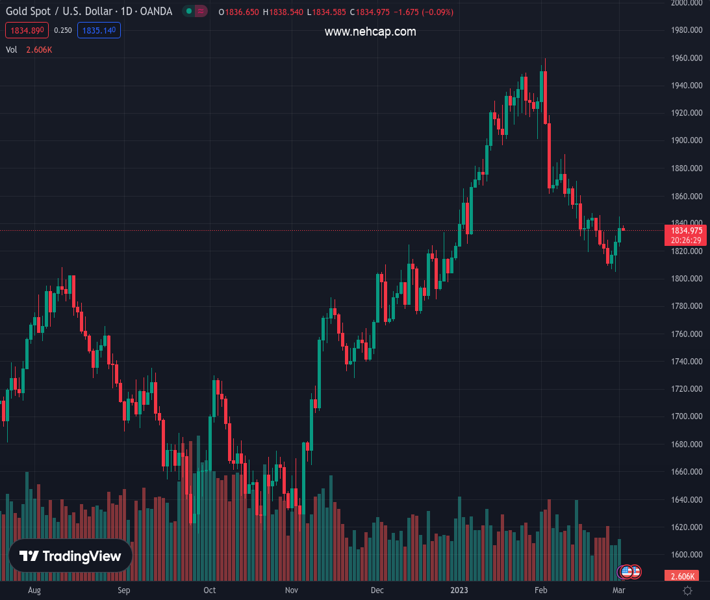
#XAUUSD @ 1834.86 Gold price is oscillating in a narrow range below $1840.00 as US yields refresh a three-month high above 4%. (Pivot Orderbook analysis)
…
This is a premium post.
[s2If !current_user_can(access_s2member_level4)]Please register for PREMIUM VERSION HERE to read full post below containing analysis. In case of any error or you think you are not able to read the full post below, please email us at support#nehcap.com [lwa][/s2If] [s2If current_user_can(access_s2member_level4)]
- Gold price is oscillating in a narrow range below $1840.00 as US yields refresh a three-month high above 4%.
- The USD Index is dealing with wild movements, which are generally followed by a volatility contraction.
- Tight US labor market looks to cool down ahead amid lower job postings on employment portals.
The pair currently trades last at 1834.86.
The previous day high was 1844.69 while the previous day low was 1823.12. The daily 38.2% Fib levels comes at 1836.45, expected to provide resistance. Similarly, the daily 61.8% fib level is at 1831.36, expected to provide support.
Gold price (XAU/USD) has delivered a downside break of the back-and-forth auction formed below the critical resistance of $1,840.00 in the Asian session. The precious metal has corrected gradually after a perpendicular upside move to $1,844.00.
The US Dollar Index (DXY) is dealing with wild movements, which are generally followed by a volatility contraction. S&P500 futures have surrendered their marginal gains and are now adding to Wednesday’s losses, portraying a rebound in the risk-aversion theme. Meanwhile, the 10-year US Treasury yields have refreshed their three-month high at 4.01%.
Wall Street Journal (WSJ) reported that figures from two large online recruitment companies ZipRecruiter Inc. and Recruit Holdings Co indicate a decline in the number of job postings in December. Contrary to that, the US Department of Labor reported huge job openings in December.
The Department clarified that more jobs are coming from restaurants, hospitals, nursing homes, and child-care centers and not from firms. Shark producers and big tech firms are focused on lay-off programs considering a dismal economic outlook. Therefore, the labor market could cool down sooner and the Federal Reserve (Fed), which is hiking rates to decelerate growth and inflation would consider the further decline in the policy tightening pace.
Gold price is struggling to extend its reversal move above the horizontal resistance plotted from February 21 high at $1,843.90 on a two-hour scale. Earlier, the precious metal delivered a breakout of the downward-sloping trendline plotted from February 9 high at $1,890.27.
After a vertical move, a mean reversion to the 20-period Exponential Moving Average (EMA) at $1,831.50 is highly expected.
The Relative Strength Index (RSI) (14) has not surrendered the bullish range of 60.00-80.00, indicating that the upside momentum is still active.
Technical Levels: Supports and Resistances
XAUUSD currently trading at 1835.6 at the time of writing. Pair opened at 1837.34 and is trading with a change of -0.09 % .
| Overview | Overview.1 | |
|---|---|---|
| 0 | Today last price | 1835.60 |
| 1 | Today Daily Change | -1.74 |
| 2 | Today Daily Change % | -0.09 |
| 3 | Today daily open | 1837.34 |
The pair is trading below its 20 Daily moving average @ 1848.01, below its 50 Daily moving average @ 1866.6 , above its 100 Daily moving average @ 1797.08 and above its 200 Daily moving average @ 1775.55
| Trends | Trends.1 | |
|---|---|---|
| 0 | Daily SMA20 | 1848.01 |
| 1 | Daily SMA50 | 1866.60 |
| 2 | Daily SMA100 | 1797.08 |
| 3 | Daily SMA200 | 1775.55 |
The previous day high was 1844.69 while the previous day low was 1823.12. The daily 38.2% Fib levels comes at 1836.45, expected to provide resistance. Similarly, the daily 61.8% fib level is at 1831.36, expected to provide support.
Note the levels of interest below:
- Pivot support is noted at 1825.41, 1813.48, 1803.84
- Pivot resistance is noted at 1846.98, 1856.62, 1868.55
| Levels | Levels.1 |
|---|---|
| Previous Daily High | 1844.69 |
| Previous Daily Low | 1823.12 |
| Previous Weekly High | 1847.59 |
| Previous Weekly Low | 1808.99 |
| Previous Monthly High | 1959.80 |
| Previous Monthly Low | 1804.76 |
| Daily Fibonacci 38.2% | 1836.45 |
| Daily Fibonacci 61.8% | 1831.36 |
| Daily Pivot Point S1 | 1825.41 |
| Daily Pivot Point S2 | 1813.48 |
| Daily Pivot Point S3 | 1803.84 |
| Daily Pivot Point R1 | 1846.98 |
| Daily Pivot Point R2 | 1856.62 |
| Daily Pivot Point R3 | 1868.55 |
[/s2If]
Join Our Telegram Group


