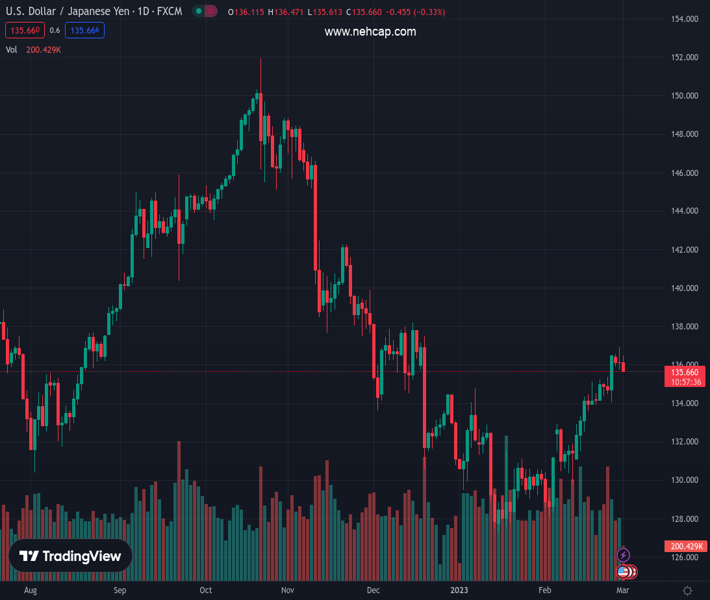
#USDJPY @ 136.397 comes under some selling pressure on Wednesday amid broad-based USD weakness. (Pivot Orderbook analysis)
…
This is a premium post.
[s2If !current_user_can(access_s2member_level4)]Please register for PREMIUM VERSION HERE to read full post below containing analysis. In case of any error or you think you are not able to read the full post below, please email us at support#nehcap.com [lwa][/s2If] [s2If current_user_can(access_s2member_level4)]
- USD/JPY comes under some selling pressure on Wednesday amid broad-based USD weakness.
- The Fed-BoJ policy divergence could lend support to the pair and help limit any further losses.
- A positive risk tone could undermine the safe-haven JPY and further warrants caution for bears.
The pair currently trades last at 136.397.
The previous day high was 136.92 while the previous day low was 135.73. The daily 38.2% Fib levels comes at 136.19, expected to provide support. Similarly, the daily 61.8% fib level is at 136.47, expected to provide resistance.
The USD/JPY pair attracts some sellers following an intraday uptick to the 136.45 area on Wednesday and moves further away from the YTD peak touched the previous day. Spot prices slide closer to the mid-136.00s during the first half of the European session, though any meaningful corrective decline seems elusive.
A sharp US DOllar retracement slide from a multi-week high turns out to be a key factor exerting some pressure on the USD/JPY pair. The downside, however, is likely to remain limited, at least for the time being, amid the divergent Bank of Japan(BoJ)-Fed monetary policy outlook. This, in turn, warrants some caution for aggressive bearish traders and positioning for deeper losses.
In fact, the incoming BoJ Governor Kazuo Ueda and Deputy Governor nominee Shinichi Uchida recently stressed the need to maintain the ultra-loose monetary policy to support the fragile domestic economy. In contrast, the US central bank is universally expected to stick to its hawkish stance for longer and continue hiking interest rates in the wake of stubbornly high inflation.
The prospects for further policy tightening by the Fed remain supportive of elevated US Treasury bond yields and favour the USD bulls. Apart from this, signs of stability in the equity markets, bolstered by the upbeat Chinese PMIs, could undermine demand for the safe-haven Japanese Yen (JPY). This, in turn, should lend some support to the USD/JPY pair and help limit the downside.
Hence, it will be prudent to wait for strong follow-through selling before confirming that the USD/JPY pair’s recent appreciating move witnessed over the past month or so has run out of steam. Traders now look forward to the release of the US ISM Manufacturing PMI. This, along with the US bond yields, will influence the USD price dynamics and provide some impetus to the major.
Technical Levels: Supports and Resistances
USDJPY currently trading at 135.71 at the time of writing. Pair opened at 136.14 and is trading with a change of -0.32 % .
| Overview | Overview.1 | |
|---|---|---|
| 0 | Today last price | 135.71 |
| 1 | Today Daily Change | -0.43 |
| 2 | Today Daily Change % | -0.32 |
| 3 | Today daily open | 136.14 |
The pair is trading above its 20 Daily moving average @ 133.1, above its 50 Daily moving average @ 131.86 , below its 100 Daily moving average @ 136.97 and below its 200 Daily moving average @ 137.18
| Trends | Trends.1 | |
|---|---|---|
| 0 | Daily SMA20 | 133.10 |
| 1 | Daily SMA50 | 131.86 |
| 2 | Daily SMA100 | 136.97 |
| 3 | Daily SMA200 | 137.18 |
The previous day high was 136.92 while the previous day low was 135.73. The daily 38.2% Fib levels comes at 136.19, expected to provide support. Similarly, the daily 61.8% fib level is at 136.47, expected to provide resistance.
Note the levels of interest below:
- Pivot support is noted at 135.61, 135.08, 134.42
- Pivot resistance is noted at 136.79, 137.45, 137.98
| Levels | Levels.1 |
|---|---|
| Previous Daily High | 136.92 |
| Previous Daily Low | 135.73 |
| Previous Weekly High | 136.52 |
| Previous Weekly Low | 133.92 |
| Previous Monthly High | 136.92 |
| Previous Monthly Low | 128.08 |
| Daily Fibonacci 38.2% | 136.19 |
| Daily Fibonacci 61.8% | 136.47 |
| Daily Pivot Point S1 | 135.61 |
| Daily Pivot Point S2 | 135.08 |
| Daily Pivot Point S3 | 134.42 |
| Daily Pivot Point R1 | 136.79 |
| Daily Pivot Point R2 | 137.45 |
| Daily Pivot Point R3 | 137.98 |
[/s2If]
Join Our Telegram Group


