#EURUSD @ 1.08668 pauses two-day downtrend but struggles to extend intraday gains. (Pivot Orderbook analysis)
…
This is a premium post.
[s2If !current_user_can(access_s2member_level4)]Please register for PREMIUM VERSION HERE to read full post below containing analysis. In case of any error or you think you are not able to read the full post below, please email us at support#nehcap.com [lwa][/s2If] [s2If current_user_can(access_s2member_level4)]
- EUR/USD pauses two-day downtrend but struggles to extend intraday gains.
- Markets sentiment remains divided as firmer yields probe stock futures while Asian equities cheer China’s return.
- Hawkish concerns from ECB contrast with hopes of Fed’s dovish hike to tease buyers.
- Germany’s preliminary Q4 GDP could direct intraday traders amid a light calendar in the US.
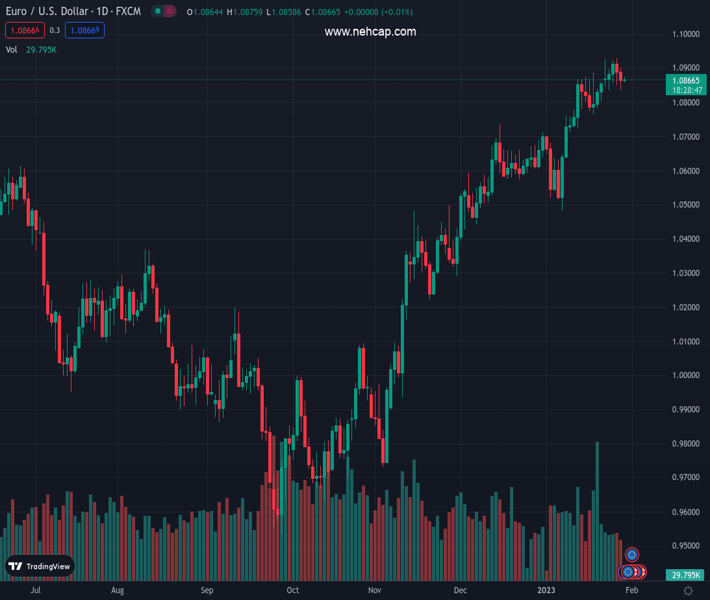
The pair currently trades last at 1.08668.
The previous day high was 1.09 while the previous day low was 1.0838. The daily 38.2% Fib levels comes at 1.0862, expected to provide support. Similarly, the daily 61.8% fib level is at 1.0877, expected to provide resistance.
EUR/USD treads water around 1.0870-60 as markets remain on a dicey floor ahead of the key central bank meetings and data. Adding strength to the market’s indecision could be the return of China and fears of a softer growth number from Germany.
That said, the US Dollar Index (DXY) picks up bids to defend the 102.00 round figure as the US 10-year Treasury yields remain firmer around 3.51% after snapping a two-week downtrend.
It’s worth noting, however, that the mixed US data and receding hawkish bias from the Fed, contrasts with the hopes of stronger rate hikes from the European Central Bank (ECB), keeps the EUR/USD buyers hopeful.
Additionally underpinning the EUR/USD upside are the mixed US data and the cautious optimism in the market as China returns to trading after one full week of the Lunar New Year holidays.
Talking about the data, the Federal Reserve’s preferred gauge of inflation, namely the Core Personal Consumption Expenditures (PCE) Price Index, matched 4.4% YoY market forecast versus 4.7% prior while the monthly figure rose to 0.3% versus 0.2% expected and previous readings. Ahead of that, the US Bureau of Economic Analysis’ (BEA) first estimate of the US fourth quarter (Q4) Gross Domestic Product marked an annualized growth rate of 2.9% versus 2.6% expected and 3.2% prior. On the same line, the Durable Goods Orders jumped 5.6% in December versus the 2.5% market forecast and -1.7% upwardly revised prior.
While portraying the mood, the US Treasury bond yields grind higher but the stock futures print mild losses and challenge the EUR/USD traders. As a result, the first readings of Germany’s fourth quarter (Q4) Gross Domestic Product (GDP), expected to the east to 0.0% versus 0.4% prior, will be important to watch for immediate directions as downbeat German data allows the EUR/USD bears to extend two-day downtrend.
However, major attention will be given to how well the Fed can push back the dovish concerns, as well as the ECB’s ability to please the hawks.
Despite the latest pause in a two-day downtrend, the EUR/USD buyers need to cross the descending resistance line from Thursday, close to 1.0880 at the latest, to retake control.
Also read: EUR/USD Price Analysis: Fades bounce off fortnight-old support line below 1.0900
Technical Levels: Supports and Resistances
EURUSD currently trading at 1.0866 at the time of writing. Pair opened at 1.0865 and is trading with a change of 0.01% % .
| Overview | Overview.1 | |
|---|---|---|
| 0 | Today last price | 1.0866 |
| 1 | Today Daily Change | 0.0001 |
| 2 | Today Daily Change % | 0.01% |
| 3 | Today daily open | 1.0865 |
The pair remains strongly bullish on the daily timeframe. It trades above its 20 SMA @ 1.077, 50 SMA 1.0624, 100 SMA @ 1.0277 and 200 SMA @ 1.0312.
| Trends | Trends.1 | |
|---|---|---|
| 0 | Daily SMA20 | 1.0770 |
| 1 | Daily SMA50 | 1.0624 |
| 2 | Daily SMA100 | 1.0277 |
| 3 | Daily SMA200 | 1.0312 |
The previous day high was 1.09 while the previous day low was 1.0838. The daily 38.2% Fib levels comes at 1.0862, expected to provide support. Similarly, the daily 61.8% fib level is at 1.0877, expected to provide resistance.
Note the levels of interest below:
- Pivot support is noted at 1.0835, 1.0805, 1.0773
- Pivot resistance is noted at 1.0898, 1.093, 1.096
| Levels | Levels.1 |
|---|---|
| Previous Daily High | 1.0900 |
| Previous Daily Low | 1.0838 |
| Previous Weekly High | 1.0930 |
| Previous Weekly Low | 1.0835 |
| Previous Monthly High | 1.0736 |
| Previous Monthly Low | 1.0393 |
| Daily Fibonacci 38.2% | 1.0862 |
| Daily Fibonacci 61.8% | 1.0877 |
| Daily Pivot Point S1 | 1.0835 |
| Daily Pivot Point S2 | 1.0805 |
| Daily Pivot Point S3 | 1.0773 |
| Daily Pivot Point R1 | 1.0898 |
| Daily Pivot Point R2 | 1.0930 |
| Daily Pivot Point R3 | 1.0960 |
[/s2If]
Join Our Telegram Group


