#AUDUSD @ 0.71120 Price Analysis: Australian Dollar faces heat as market mood sours (Pivot Orderbook analysis)
…
This is a premium post.
[s2If !current_user_can(access_s2member_level4)]Please register for PREMIUM VERSION HERE to read full post below containing analysis. In case of any error or you think you are not able to read the full post below, please email us at support#nehcap.com [lwa][/s2If] [s2If current_user_can(access_s2member_level4)]
The pair currently trades last at 0.71120.
The previous day high was 0.7143 while the previous day low was 0.7079. The daily 38.2% Fib levels comes at 0.7118, expected to provide resistance. Similarly, the daily 61.8% fib level is at 0.7103, expected to provide support.
The AUD/USD pair has corrected sharply to near 0.7100 in the early European session. The Aussie asset has sensed selling pressure as investors have turned risk averse ahead of the release of the United States Personal Consumption Expenditure (PCE) Price Index data. Meanwhile, an improvement in the safe-haven’s appeal has strengthened the US Dollar Index (DXY).
S&P500 futures has demonstrated a sell-off as further interest rate hikes by the Federal Reserve (Fed) might accelerate recession fears. The 10-year US Treasury yields has added gains further to near 3.53%.
On an hourly scale, AUD/USD is oscillating in an Ascending Triangle chart pattern that indicates a sheer contraction in volatility. The upward-sloping trendline of the chart pattern is plotted from January 25 average price at 0.7061 while the horizontal resistance is placed from January 26 high around 0.7140.
The 20-period Exponential Moving Average (EMA) at 0.7110 has overlapped the asset, which indicates a rangebound acution profile.
It is observed that the Relative Strength Index (RSI) (14) has shifted into the 40.00-60.00 range from the bullish range of 60.00-80.00, which conveys that the bullish momentum has faded now.
Should the asset breaks above January 26 high at 0.7142, Aussie asset will deliver a breakout the Ascending Triangle, which will drive the major towards the round-level resistance of 0.7200. A breach of the latter will expose the asset for more upside toward June 3 high at 0.7283.
On the contrary, a downside move below December 29 low at 0.6710 will drag the major further toward December 22 low at 0.6650 followed by November 21 low at 0.6585.
AUD/USD hourly chart
Technical Levels: Supports and Resistances
AUDUSD currently trading at 0.7111 at the time of writing. Pair opened at 0.7116 and is trading with a change of -0.07 % .
| Overview | Overview.1 | |
|---|---|---|
| 0 | Today last price | 0.7111 |
| 1 | Today Daily Change | -0.0005 |
| 2 | Today Daily Change % | -0.0700 |
| 3 | Today daily open | 0.7116 |
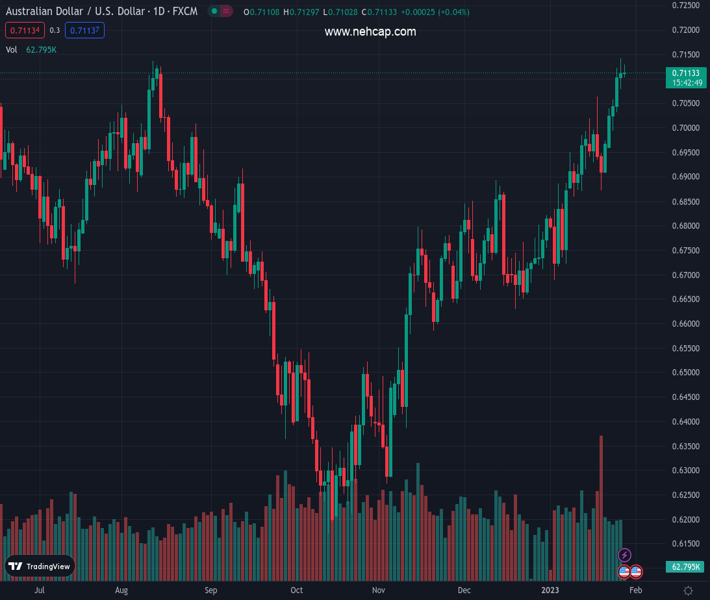
The pair remains strongly bullish on the daily timeframe. It trades above its 20 SMA @ 0.6926, 50 SMA 0.6808, 100 SMA @ 0.6653 and 200 SMA @ 0.6813.
| Trends | Trends.1 | |
|---|---|---|
| 0 | Daily SMA20 | 0.6926 |
| 1 | Daily SMA50 | 0.6808 |
| 2 | Daily SMA100 | 0.6653 |
| 3 | Daily SMA200 | 0.6813 |
The previous day high was 0.7143 while the previous day low was 0.7079. The daily 38.2% Fib levels comes at 0.7118, expected to provide resistance. Similarly, the daily 61.8% fib level is at 0.7103, expected to provide support.
Note the levels of interest below:
- Pivot support is noted at 0.7083, 0.705, 0.702
- Pivot resistance is noted at 0.7146, 0.7176, 0.7209
| Levels | Levels.1 |
|---|---|
| Previous Daily High | 0.7143 |
| Previous Daily Low | 0.7079 |
| Previous Weekly High | 0.7064 |
| Previous Weekly Low | 0.6872 |
| Previous Monthly High | 0.6893 |
| Previous Monthly Low | 0.6629 |
| Daily Fibonacci 38.2% | 0.7118 |
| Daily Fibonacci 61.8% | 0.7103 |
| Daily Pivot Point S1 | 0.7083 |
| Daily Pivot Point S2 | 0.7050 |
| Daily Pivot Point S3 | 0.7020 |
| Daily Pivot Point R1 | 0.7146 |
| Daily Pivot Point R2 | 0.7176 |
| Daily Pivot Point R3 | 0.7209 |
[/s2If]
Join Our Telegram Group


