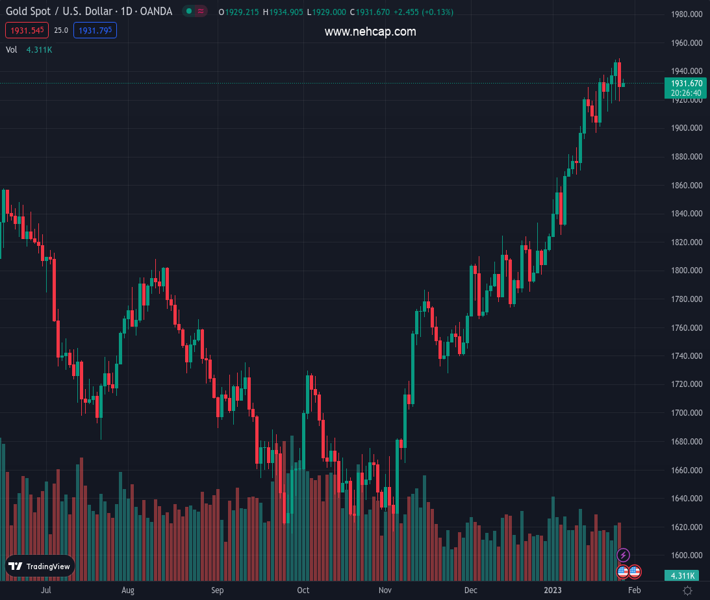
#XAUUSD @ 1,930.94 Gold price has refreshed its day high at $1,935.00 amid a volatile USD Index. (Pivot Orderbook analysis)
…
This is a premium post.
[s2If !current_user_can(access_s2member_level4)]Please register for PREMIUM VERSION HERE to read full post below containing analysis. In case of any error or you think you are not able to read the full post below, please email us at support#nehcap.com [lwa][/s2If] [s2If current_user_can(access_s2member_level4)]
- Gold price has refreshed its day high at $1,935.00 amid a volatile USD Index.
- The Fed is expected to hike interest rates by 25 bps to 4.50-4.75% next week.
- Gold bulls need immense strength to take out pessimism as the higher-low structure has messed up.
The pair currently trades last at 1930.94.
The previous day high was 1949.27 while the previous day low was 1918.67. The daily 38.2% Fib levels comes at 1930.36, expected to provide support. Similarly, the daily 61.8% fib level is at 1937.58, expected to provide resistance.
Gold price (XAU/USD) has refreshed its day’s high at $1,935.00 in the Asian session. The precious metal picked strength after a minor drop below $1,930.00, which poised a bargain opportunity for gold buyers. The US Dollar Index (DXY) slipped sharply after failing to surpass the critical hurdle of 101.80.
The USD Index dropped to near 101.40 and is likely to remain on tenterhooks ahead of the release of the Federal Reserve (Fed)’s most preferred inflation tool, the United States Personal Consumption Expenditure (PCE) Price Index (Dec). The economic data is seen rising by 0.3% vs. 0.2% reported earlier.
Meanwhile, the risk profile is displaying dubious outcomes as S&P500 futures are showing decent losses after an upbeat Thursday trading session. While the risk-perceived currencies are showing immense strength.
Gold price could face a squeeze in volatility as investors are broadly shifting their focus towards the announcement of the interest rate decision by Fed chair Jerome Powell next week. As per the CME FedWatch tool, the chances of a 50 basis point (bps) interest rate hike are less than even 1%. Therefore, the borrowing rates might escalate to 4.50-4.75%.
Gold price is auctioning in a Rising Wedge chart pattern on an hourly scale, which indicates a volatility contraction on a broader note. The precious metals displayed a responsive buying action after dropping below January 25 low at $1,919.91, recorded a lower low, however the expression of the lower low is weak as buyers jumped in and demonstrated a firmer buying interest. But, one cannot deny the fact that the structure has messed up and the Gold bulls will require immense strength to remain in a positive trajectory.
The Gold price has recovered to near the 20-period Exponential Moving Average (EMA) at $1.933.16. Meanwhile, the Relative Strength Index (RSI) (14) is oscillating in a 40.00-60.00 range, which indicates a consolidation ahead.
Technical Levels: Supports and Resistances
XAUUSD currently trading at 1932.9 at the time of writing. Pair opened at 1929.72 and is trading with a change of 0.16 % .
| Overview | Overview.1 | |
|---|---|---|
| 0 | Today last price | 1932.90 |
| 1 | Today Daily Change | 3.18 |
| 2 | Today Daily Change % | 0.16 |
| 3 | Today daily open | 1929.72 |
The pair remains strongly bullish on the daily timeframe. It trades above its 20 SMA @ 1890.99, 50 SMA 1825.69, 100 SMA @ 1753.19 and 200 SMA @ 1775.5.
| Trends | Trends.1 | |
|---|---|---|
| 0 | Daily SMA20 | 1890.99 |
| 1 | Daily SMA50 | 1825.69 |
| 2 | Daily SMA100 | 1753.19 |
| 3 | Daily SMA200 | 1775.50 |
The previous day high was 1949.27 while the previous day low was 1918.67. The daily 38.2% Fib levels comes at 1930.36, expected to provide support. Similarly, the daily 61.8% fib level is at 1937.58, expected to provide resistance.
Note the levels of interest below:
- Pivot support is noted at 1915.84, 1901.95, 1885.24
- Pivot resistance is noted at 1946.44, 1963.15, 1977.04
| Levels | Levels.1 |
|---|---|
| Previous Daily High | 1949.27 |
| Previous Daily Low | 1918.67 |
| Previous Weekly High | 1937.57 |
| Previous Weekly Low | 1896.63 |
| Previous Monthly High | 1833.38 |
| Previous Monthly Low | 1765.89 |
| Daily Fibonacci 38.2% | 1930.36 |
| Daily Fibonacci 61.8% | 1937.58 |
| Daily Pivot Point S1 | 1915.84 |
| Daily Pivot Point S2 | 1901.95 |
| Daily Pivot Point S3 | 1885.24 |
| Daily Pivot Point R1 | 1946.44 |
| Daily Pivot Point R2 | 1963.15 |
| Daily Pivot Point R3 | 1977.04 |
[/s2If]
Join Our Telegram Group


