#AUDUSD @ 0.71194 bulls retreat from seven-month high while probing five-day uptrend., @nehcap view: Pullback expected (Pivot Orderbook analysis)
…
This is a premium post.
[s2If !current_user_can(access_s2member_level4)]Please register for PREMIUM VERSION HERE to read full post below containing analysis. In case of any error or you think you are not able to read the full post below, please email us at support#nehcap.com [lwa][/s2If] [s2If current_user_can(access_s2member_level4)]
- AUD/USD bulls retreat from seven-month high while probing five-day uptrend.
- Rising wedge bearish chart pattern, looming bear cross on MACD tease sellers.
- 100-SMA, six-week-old horizontal support add to the downside filters.
- Further upside could aim for June 2022 peak.
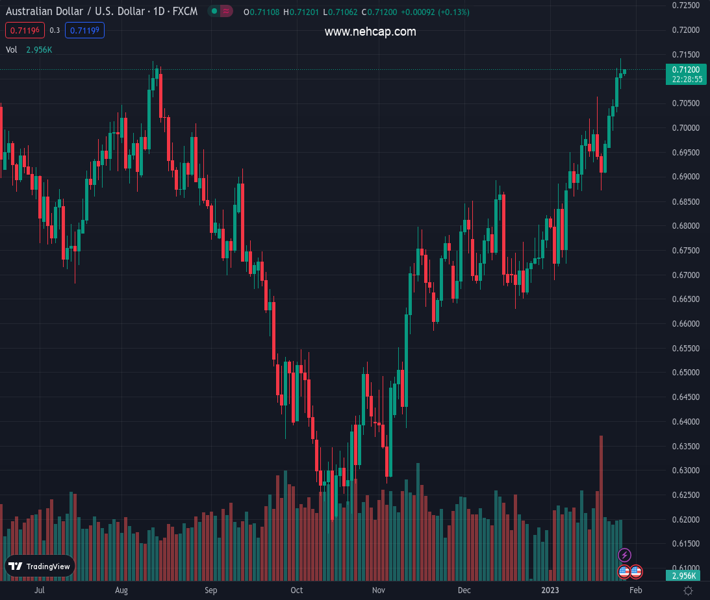
The pair currently trades last at 0.71194.
The previous day high was 0.7123 while the previous day low was 0.7032. The daily 38.2% Fib levels comes at 0.7088, expected to provide support. Similarly, the daily 61.8% fib level is at 0.7067, expected to provide support.
AUD/USD struggles for clear directions around the highest levels since June, marked the previous day, as it stays defensive near 0.7115 amid early Friday morning in Asia. In doing so, the Aussie pair also challenges the previous five-day winning streak and teases sellers by forming a rising wedge bearish chart pattern on the four-hour play.
Not only the rising wedge but the impending bear cross on the MACD also favors the odds of a pullback by the Aussie pair.
That said, the stated bearish pattern’s lower line, close to 0.7085 by the press time, appears the key as a break of which could confirm the rising wedge breakdown that theoretically suggests the downturn towards the 0.6800 mark.
However, the 100-SMA and multiple levels marked since mid-December 2022, respectively near 0.6950 and 0.6890, could challenge the further downside.
Meanwhile, recovery moves need to refresh the latest multi-month high, marked on Thursday around 0.7140, as well as the stated wedge’s top surrounding 0.7145, to recall the AUD/USD buyers.
Following that, a run-up toward the June 2022 high near 0.7285 can’t be ruled out.
Overall, AUD/USD buyers appear running out of steam but the bears have a bumpy road to track.
Trend: Pullback expected
Technical Levels: Supports and Resistances
AUDUSD currently trading at 0.7117 at the time of writing. Pair opened at 0.7105 and is trading with a change of 0.17% % .
| Overview | Overview.1 | |
|---|---|---|
| 0 | Today last price | 0.7117 |
| 1 | Today Daily Change | 0.0012 |
| 2 | Today Daily Change % | 0.17% |
| 3 | Today daily open | 0.7105 |
The pair remains strongly bullish on the daily timeframe. It trades above its 20 SMA @ 0.6909, 50 SMA 0.6799, 100 SMA @ 0.6649 and 200 SMA @ 0.6814.
| Trends | Trends.1 | |
|---|---|---|
| 0 | Daily SMA20 | 0.6909 |
| 1 | Daily SMA50 | 0.6799 |
| 2 | Daily SMA100 | 0.6649 |
| 3 | Daily SMA200 | 0.6814 |
The previous day high was 0.7123 while the previous day low was 0.7032. The daily 38.2% Fib levels comes at 0.7088, expected to provide support. Similarly, the daily 61.8% fib level is at 0.7067, expected to provide support.
Note the levels of interest below:
- Pivot support is noted at 0.7051, 0.6996, 0.6961
- Pivot resistance is noted at 0.7141, 0.7177, 0.7231
| Levels | Levels.1 |
|---|---|
| Previous Daily High | 0.7123 |
| Previous Daily Low | 0.7032 |
| Previous Weekly High | 0.7064 |
| Previous Weekly Low | 0.6872 |
| Previous Monthly High | 0.6893 |
| Previous Monthly Low | 0.6629 |
| Daily Fibonacci 38.2% | 0.7088 |
| Daily Fibonacci 61.8% | 0.7067 |
| Daily Pivot Point S1 | 0.7051 |
| Daily Pivot Point S2 | 0.6996 |
| Daily Pivot Point S3 | 0.6961 |
| Daily Pivot Point R1 | 0.7141 |
| Daily Pivot Point R2 | 0.7177 |
| Daily Pivot Point R3 | 0.7231 |
[/s2If]
Join Our Telegram Group


