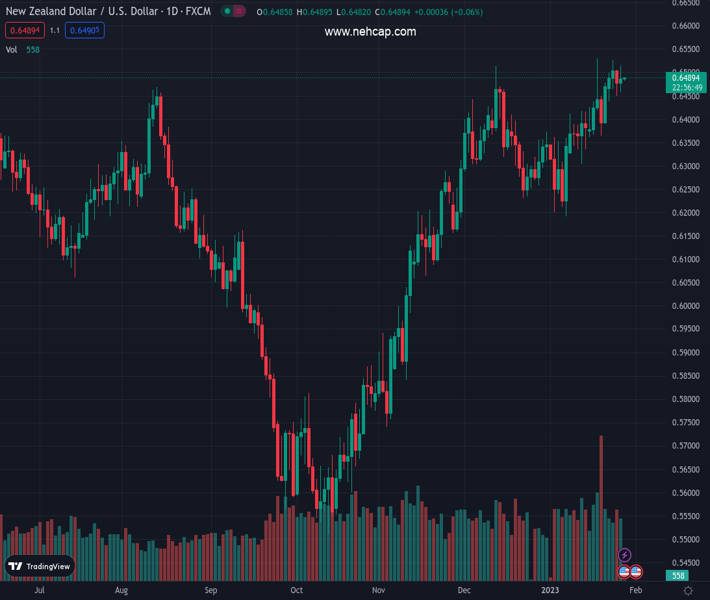
#NZDUSD @ 0.64870 A volatility contraction continues in ahead of the US PCE Price Index data. (Pivot Orderbook analysis)
…
This is a premium post.
[s2If !current_user_can(access_s2member_level4)]Please register for PREMIUM VERSION HERE to read full post below containing analysis. In case of any error or you think you are not able to read the full post below, please email us at support#nehcap.com [lwa][/s2If] [s2If current_user_can(access_s2member_level4)]
- A volatility contraction continues in NZD/USD ahead of the US PCE Price Index data.
- The Kiwi asset is displaying topsy-turvy moves in an Ascending Triangle formation.
- The USD Index failed to capitalize on upbeat US economic data as the odds of Fed’s smaller rate hike are still solid.
The pair currently trades last at 0.64870.
The previous day high was 0.6526 while the previous day low was 0.645. The daily 38.2% Fib levels comes at 0.6479, expected to provide support. Similarly, the daily 61.8% fib level is at 0.6497, expected to provide resistance.
The struggle of the NZD/USD pair to shift its business above the psychological resistance of 0.6500 continues as the US Dollar Index (DXY) has confidently defended itself from refreshing its seven-month low after the release of the upbeat United States economic data. The Kiwi asset is back inside the woods and is expected to display back-and-forth action till the release of the US Personal Consumption Expenditure (PCE) Price Index (Dec) data.
Meanwhile, the risk profile is favorable as S&P500 ended with significant gains. The US Dollar Index trimmed to 101.40 after a responsive buying action as the odds of a small interest rate hike by the Federal Reserve (Fed) are extremely solid.
On an hourly scale, NZD/USD is displaying topsy-turvy action in an Ascending Triangle chart pattern that indicates volatility contraction. The New Zealand Dollar sensed demand after dropping to near the upward-sloping trendline plotted from January 19 low at 0.6365 while the horizontal resistance is placed from January 18 high at 0.6531.
The 20-EMA at 0.6483 is overlapping the Kiwi asset, which indicates consolidation ahead.
Also, the Relative Strength Index (RSI) (14) is oscillating in a 40.00-60.00 range, which indicates an absence of a potential trigger for a decisive move.
For an upside move, the asset needs to surpass Wednesday’s high at 0.6530, which will drive the asset toward June 3 high at 0.6576. A breach of the latter will expose the asset to the round-level resistance at 0.6600.
On the flip side, a breakdown below January 16 high at 0.6426 will drag the Kiwi asset toward January 17 low at 0.6366 followed by January 12 low around 0.6300.
Technical Levels: Supports and Resistances
NZDUSD currently trading at 0.6487 at the time of writing. Pair opened at 0.6484 and is trading with a change of 0.05 % .
| Overview | Overview.1 | |
|---|---|---|
| 0 | Today last price | 0.6487 |
| 1 | Today Daily Change | 0.0003 |
| 2 | Today Daily Change % | 0.0500 |
| 3 | Today daily open | 0.6484 |
The pair remains strongly bullish on the daily timeframe. It trades above its 20 SMA @ 0.6381, 50 SMA 0.6332, 100 SMA @ 0.6077 and 200 SMA @ 0.6197.
| Trends | Trends.1 | |
|---|---|---|
| 0 | Daily SMA20 | 0.6381 |
| 1 | Daily SMA50 | 0.6332 |
| 2 | Daily SMA100 | 0.6077 |
| 3 | Daily SMA200 | 0.6197 |
The previous day high was 0.6526 while the previous day low was 0.645. The daily 38.2% Fib levels comes at 0.6479, expected to provide support. Similarly, the daily 61.8% fib level is at 0.6497, expected to provide resistance.
Note the levels of interest below:
- Pivot support is noted at 0.6447, 0.641, 0.637
- Pivot resistance is noted at 0.6523, 0.6563, 0.66
| Levels | Levels.1 |
|---|---|
| Previous Daily High | 0.6526 |
| Previous Daily Low | 0.6450 |
| Previous Weekly High | 0.6531 |
| Previous Weekly Low | 0.6361 |
| Previous Monthly High | 0.6514 |
| Previous Monthly Low | 0.6230 |
| Daily Fibonacci 38.2% | 0.6479 |
| Daily Fibonacci 61.8% | 0.6497 |
| Daily Pivot Point S1 | 0.6447 |
| Daily Pivot Point S2 | 0.6410 |
| Daily Pivot Point S3 | 0.6370 |
| Daily Pivot Point R1 | 0.6523 |
| Daily Pivot Point R2 | 0.6563 |
| Daily Pivot Point R3 | 0.6600 |
[/s2If]
Join Our Telegram Group


