#USDCHF @ 0.92031 remains downward biased, albeit registering gains of 0.26% on Thursday. (Pivot Orderbook analysis)
…
This is a premium post.
[s2If !current_user_can(access_s2member_level4)]Please register for PREMIUM VERSION HERE to read full post below containing analysis. In case of any error or you think you are not able to read the full post below, please email us at support#nehcap.com [lwa][/s2If] [s2If current_user_can(access_s2member_level4)]
- USD/CHF remains downward biased, albeit registering gains of 0.26% on Thursday.
- The USD/CHF pair’s failure to crack the 20-day EMA would keep exposing the pair to sellers.
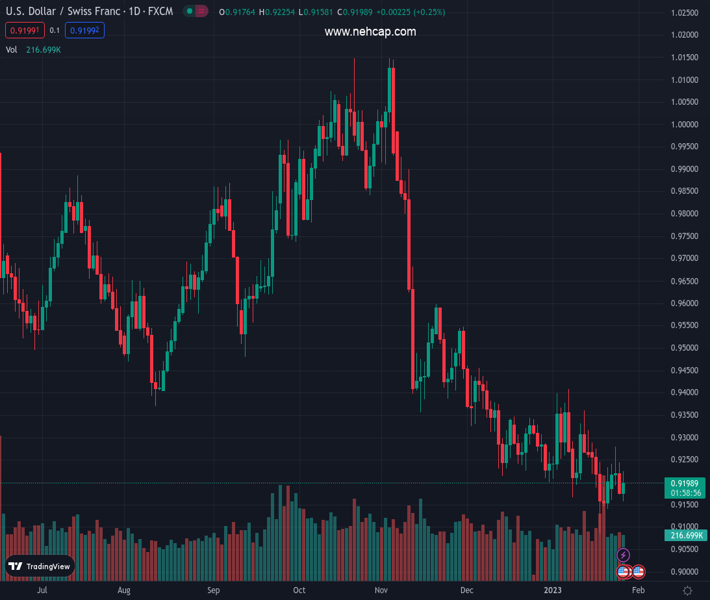
- USD/CHF Price Analysis: The downtrend is still intact, but the major appears to be bottoming.
The pair currently trades last at 0.92031.
The previous day high was 0.9245 while the previous day low was 0.9172. The daily 38.2% Fib levels comes at 0.92, expected to provide support. Similarly, the daily 61.8% fib level is at 0.9217, expected to provide resistance.
USD/CHF trims some of its Wednesday losses but is falling short of testing the 20-day Exponential Moving AVergae (EMA) at 0.9237, leaving the USD/CHF pair adrift to selling pressure. After hitting a daily high of 0.9225, it has retreated to its current spot price. At the time of writing, the USD/CHF is trading at 0.9200.
Even though the USD/CHF pair is registering a green day, the pair’s bias remains bearish. As long as buyers reclaim the January 24 daily high of 0.9360, then the USD/CHF might shift to neutral-downwards and would have a shot of testing the 50-day EMA 0.9343, ahead of the January 12 high of 0.9360. The next resistance would be the psychological 0.9400 level.
Given the backdrop, oscillators had failed to support the bullish thesis and remained in negative territory. Except for the Relative Strength Index (RSI), which sits at bearish territory but approaches the 50 mid-line. Once the RSI turns bullish, that could bolster the prospects for higher USD/CHF exchange rates.
As an alternate scenario, the USD/CHF first support would be the 0.9200 mark. Once cleared, the next demand zone to be tested would be today’s low of 0.9158. A breach of the latter and the USD/CHF could dive toward the YTD low of 0.9085.
Technical Levels: Supports and Resistances
USDCHF currently trading at 0.9203 at the time of writing. Pair opened at 0.9181 and is trading with a change of 0.24 % .
| Overview | Overview.1 | |
|---|---|---|
| 0 | Today last price | 0.9203 |
| 1 | Today Daily Change | 0.0022 |
| 2 | Today Daily Change % | 0.2400 |
| 3 | Today daily open | 0.9181 |
The pair remains strongly bearish on the daily time frame. It trades below the 20 SMA @ 0.9248, 50 SMA 0.9331, 100 SMA @ 0.9578 and 200 SMA @ 0.9635.
| Trends | Trends.1 | |
|---|---|---|
| 0 | Daily SMA20 | 0.9248 |
| 1 | Daily SMA50 | 0.9331 |
| 2 | Daily SMA100 | 0.9578 |
| 3 | Daily SMA200 | 0.9635 |
The previous day high was 0.9245 while the previous day low was 0.9172. The daily 38.2% Fib levels comes at 0.92, expected to provide support. Similarly, the daily 61.8% fib level is at 0.9217, expected to provide resistance.
Note the levels of interest below:
- Pivot support is noted at 0.9154, 0.9126, 0.908
- Pivot resistance is noted at 0.9226, 0.9272, 0.93
| Levels | Levels.1 |
|---|---|
| Previous Daily High | 0.9245 |
| Previous Daily Low | 0.9172 |
| Previous Weekly High | 0.9288 |
| Previous Weekly Low | 0.9085 |
| Previous Monthly High | 0.9471 |
| Previous Monthly Low | 0.9201 |
| Daily Fibonacci 38.2% | 0.9200 |
| Daily Fibonacci 61.8% | 0.9217 |
| Daily Pivot Point S1 | 0.9154 |
| Daily Pivot Point S2 | 0.9126 |
| Daily Pivot Point S3 | 0.9080 |
| Daily Pivot Point R1 | 0.9226 |
| Daily Pivot Point R2 | 0.9272 |
| Daily Pivot Point R3 | 0.9300 |
[/s2If]
Join Our Telegram Group


