#USDJPY @ 130.230 remains sideways, trapped within the 129.00/131.00 range. (Pivot Orderbook analysis)
…
This is a premium post.
[s2If !current_user_can(access_s2member_level4)]Please register for PREMIUM VERSION HERE to read full post below containing analysis. In case of any error or you think you are not able to read the full post below, please email us at support#nehcap.com [lwa][/s2If] [s2If current_user_can(access_s2member_level4)]
- USD/JPY remains sideways, trapped within the 129.00/131.00 range.
- Buyers are unable to conquer the 20-day Exponential Moving Average, and keep the USD/JPY pair range-bound.
- USD/JPY Price Analysis: Remains exposed to selling pressure, as its bias is still downwards.
The pair currently trades last at 130.230.
The previous day high was 130.58 while the previous day low was 129.27. The daily 38.2% Fib levels comes at 129.77, expected to provide support. Similarly, the daily 61.8% fib level is at 130.08, expected to provide support.
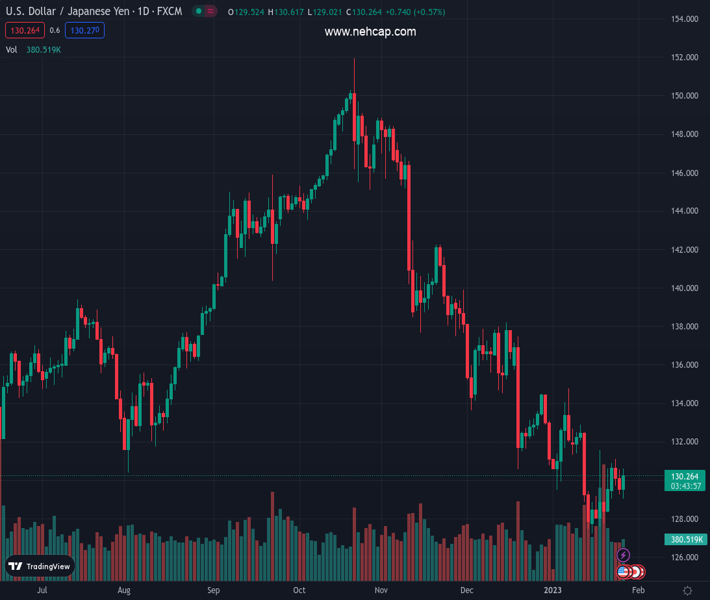
The USD/JPY bounces from weekly lows reached early Thursday at 129.02 and reclaimed the 130.00 psychological level, eyeing a test of the 20-day Exponential Moving Average (EMA) at 130.70. Nevertheless, the USD/JPY fell short and hit a daily high at 130.61, settling around current exchange rates. At the time of writing, the USD/JPY is trading at 130.34.
Although USD/JPY buyers are staging a comeback late in the week, they have been unable to crack the 20-day EMA, which exposes the pair to selling pressure. Traders should be aware that long term, the USD/JPY remains downward biased, and it can shift to neutral if buyers reclaim the January 11 high of 131.57.
Failure to crack the 20-day EMA paves the way for a bearish continuation. Therefore, the USD/JPY first support would be the psychological 130.00 figure, followed by a test of this week’s low of 129.02. A breach of the latter and the USD/JPY might fall toward the year-to-date (YTD) low of 127.21, hit on January 16.
Technical Levels: Supports and Resistances
USDJPY currently trading at 130.31 at the time of writing. Pair opened at 129.6 and is trading with a change of 0.55 % .
| Overview | Overview.1 | |
|---|---|---|
| 0 | Today last price | 130.31 |
| 1 | Today Daily Change | 0.71 |
| 2 | Today Daily Change % | 0.55 |
| 3 | Today daily open | 129.60 |
The pair remains strongly bearish on the daily time frame. It trades below the 20 SMA @ 130.59, 50 SMA 134.24, 100 SMA @ 139.73 and 200 SMA @ 136.75.
| Trends | Trends.1 | |
|---|---|---|
| 0 | Daily SMA20 | 130.59 |
| 1 | Daily SMA50 | 134.24 |
| 2 | Daily SMA100 | 139.73 |
| 3 | Daily SMA200 | 136.75 |
The previous day high was 130.58 while the previous day low was 129.27. The daily 38.2% Fib levels comes at 129.77, expected to provide support. Similarly, the daily 61.8% fib level is at 130.08, expected to provide support.
Note the levels of interest below:
- Pivot support is noted at 129.05, 128.5, 127.73
- Pivot resistance is noted at 130.37, 131.13, 131.68
| Levels | Levels.1 |
|---|---|
| Previous Daily High | 130.58 |
| Previous Daily Low | 129.27 |
| Previous Weekly High | 131.58 |
| Previous Weekly Low | 127.22 |
| Previous Monthly High | 138.18 |
| Previous Monthly Low | 130.57 |
| Daily Fibonacci 38.2% | 129.77 |
| Daily Fibonacci 61.8% | 130.08 |
| Daily Pivot Point S1 | 129.05 |
| Daily Pivot Point S2 | 128.50 |
| Daily Pivot Point S3 | 127.73 |
| Daily Pivot Point R1 | 130.37 |
| Daily Pivot Point R2 | 131.13 |
| Daily Pivot Point R3 | 131.68 |
[/s2If]
Join Our Telegram Group


