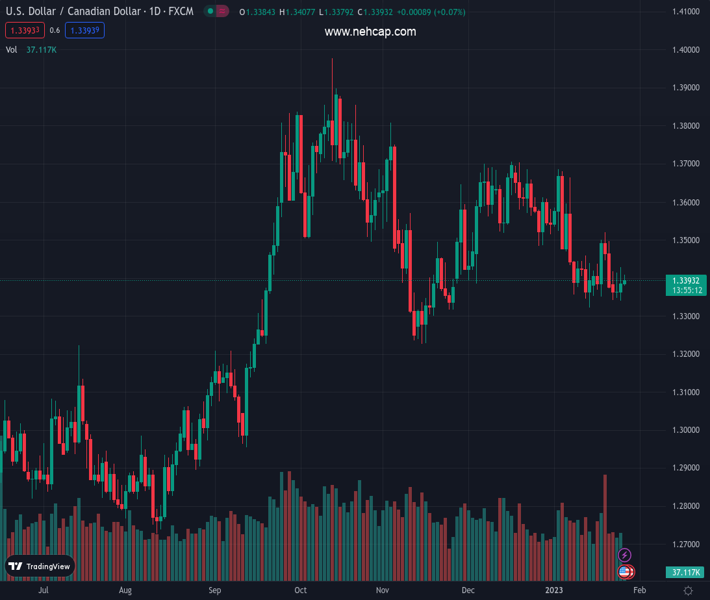
#USDCAD @ 1.33908 gains some positive traction for the second straight day, though lacks follow-through. (Pivot Orderbook analysis)
…
This is a premium post.
[s2If !current_user_can(access_s2member_level4)]Please register for PREMIUM VERSION HERE to read full post below containing analysis. In case of any error or you think you are not able to read the full post below, please email us at support#nehcap.com [lwa][/s2If] [s2If current_user_can(access_s2member_level4)]
- USD/CAD gains some positive traction for the second straight day, though lacks follow-through.
- The BoC’s pivot on Wednesday continues to undermine the Loonie and lends support to the pair.
- Bets for smaller Fed rate hikes keep the USD bulls on the defensive and might cap the upside.
- Investors might also prefer to move to the sidelines and wait for the release of the US Q4 GDP.
The pair currently trades last at 1.33908.
The previous day high was 1.3428 while the previous day low was 1.334. The daily 38.2% Fib levels comes at 1.3394, expected to provide resistance. Similarly, the daily 61.8% fib level is at 1.3374, expected to provide support.
The USD/CAD pair attracts some buying for the second straight day on Thursday and sticks to its modest intraday gains through the early European session. Currently placed around the 1.3400 mark, the pair is now looking to build on the overnight bounce from the 1.3340 area, or a nearly two-week low.
The Canadian Dollar is undermined by the Bank of Canada’s pivot on Wednesday, saying that it was time to pause the rate-hiking cycle, which, in turn, is seen lending support to the USD/CAD pair. Meanwhile, subdued action around crude oil prices fails to benefit the commodity-linked Loonie. That said, the underlying bearish sentiment surrounding the US Dollar could act as a headwind for the major, at least for the time being.
Firming expectations that the Federal Reserve will soften its hawkish stance keep the USD bulls on the defensive near an eight-month low. In fact, the CME’s FedWatch Tool points to over a 90% probability for a smaller 25 bps rate hike at the next FOMC meeting that concludes on February 1. This will mark a further moderation in the pace of the rate-hike cycle, which is seen weighing on the US Treasury bond yields and the buck.
That said, concerns about a deeper global economic downturn help limit the downside for the safe-haven greenback. Traders also seem reluctant from placing directional bets and prefer to wait for the release of the Advance US Q4 GDP later during the early North American session. Thursday’s US economic docket also features Durable Goods Orders and New Home Sales data, which might drive the USD and provide some impetus to the USD/CAD pair.
Traders this week will also confront the release of the US Core PCE Price Index on Friday, which will play a key role in influencing the Fed’s rate strategy. The key focus, however, will remain glued to the outcome of a two-day FOMC monetary policy meeting, due to be announced next Wednesday.
Technical Levels: Supports and Resistances
USDCAD currently trading at 1.3396 at the time of writing. Pair opened at 1.3385 and is trading with a change of 0.08 % .
| Overview | Overview.1 | |
|---|---|---|
| 0 | Today last price | 1.3396 |
| 1 | Today Daily Change | 0.0011 |
| 2 | Today Daily Change % | 0.0800 |
| 3 | Today daily open | 1.3385 |
The pair is trading below its 20 Daily moving average @ 1.3455, below its 50 Daily moving average @ 1.3504 , below its 100 Daily moving average @ 1.352 and above its 200 Daily moving average @ 1.3202
| Trends | Trends.1 | |
|---|---|---|
| 0 | Daily SMA20 | 1.3455 |
| 1 | Daily SMA50 | 1.3504 |
| 2 | Daily SMA100 | 1.3520 |
| 3 | Daily SMA200 | 1.3202 |
The previous day high was 1.3428 while the previous day low was 1.334. The daily 38.2% Fib levels comes at 1.3394, expected to provide resistance. Similarly, the daily 61.8% fib level is at 1.3374, expected to provide support.
Note the levels of interest below:
- Pivot support is noted at 1.3341, 1.3296, 1.3253
- Pivot resistance is noted at 1.3429, 1.3472, 1.3517
| Levels | Levels.1 |
|---|---|
| Previous Daily High | 1.3428 |
| Previous Daily Low | 1.3340 |
| Previous Weekly High | 1.3521 |
| Previous Weekly Low | 1.3351 |
| Previous Monthly High | 1.3705 |
| Previous Monthly Low | 1.3385 |
| Daily Fibonacci 38.2% | 1.3394 |
| Daily Fibonacci 61.8% | 1.3374 |
| Daily Pivot Point S1 | 1.3341 |
| Daily Pivot Point S2 | 1.3296 |
| Daily Pivot Point S3 | 1.3253 |
| Daily Pivot Point R1 | 1.3429 |
| Daily Pivot Point R2 | 1.3472 |
| Daily Pivot Point R3 | 1.3517 |
[/s2If]
Join Our Telegram Group


