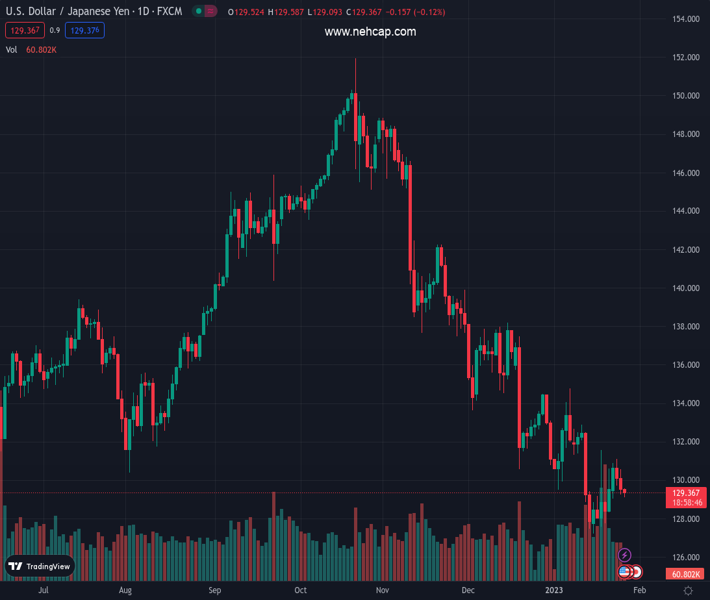
#USDJPY @ 129.391 holds lower ground as bears keep the reins for the third consecutive day., @nehcap view: Further downside expected (Pivot Orderbook analysis)
…
This is a premium post.
[s2If !current_user_can(access_s2member_level4)]Please register for PREMIUM VERSION HERE to read full post below containing analysis. In case of any error or you think you are not able to read the full post below, please email us at support#nehcap.com [lwa][/s2If] [s2If current_user_can(access_s2member_level4)]
- USD/JPY holds lower ground as bears keep the reins for the third consecutive day.
- One-week-old symmetrical triangle restricts immediate moves.
- Downbeat RSI, bearish MACD signals favor sellers to refresh multi-month low.
- Buyers need validation from six-week-old descending trend line to retake control.
The pair currently trades last at 129.391.
The previous day high was 130.58 while the previous day low was 129.27. The daily 38.2% Fib levels comes at 129.77, expected to provide resistance. Similarly, the daily 61.8% fib level is at 130.08, expected to provide resistance.
USD/JPY licks its wounds around 129.40 as it seesaws near an intraday low during early Thursday. In doing so, the Yen pair consolidates the latest losses as a two-day losing streak.
Even so, the quote prints mild losses while staying inside a one-week-old symmetrical triangle, between 128.50 and 131.00 by the press time.
That said, the bearish MACD signals join the downward-sloping RSI (14) line to keep USD/JPY sellers hopeful. Also challenging the Yen pair buyers could be a descending resistance line from mid-December 2022, close to 131.80.
It should be noted that the 50% Fibonacci retracement level of the pair’s December 15 to January 16 downtrend, near 132.70, precedes the one-month-long horizontal resistance area around 134.50-75 to challenge the pair’s further upside.
On the flip side, a clear break of the stated triangle’s support, close to 128.50, becomes necessary for the USD/JPY seller’s conviction.
Following that, the monthly low surrounding 127.20, also the lowest level in eight months, could probe the Yen pair bears before directing them to the 61.8% Fibonacci Expansion (FE) of the quote’s moves between December 20 and January 18, around 125.20.
Overall, USD/JPY is funneling down towards a breakout point and hints at volatility expansion moving forward.
Trend: Further downside expected
Technical Levels: Supports and Resistances
USDJPY currently trading at 129.4 at the time of writing. Pair opened at 129.6 and is trading with a change of -0.15% % .
| Overview | Overview.1 | |
|---|---|---|
| 0 | Today last price | 129.4 |
| 1 | Today Daily Change | -0.20 |
| 2 | Today Daily Change % | -0.15% |
| 3 | Today daily open | 129.6 |
The pair remains strongly bearish on the daily time frame. It trades below the 20 SMA @ 130.59, 50 SMA 134.24, 100 SMA @ 139.73 and 200 SMA @ 136.75.
| Trends | Trends.1 | |
|---|---|---|
| 0 | Daily SMA20 | 130.59 |
| 1 | Daily SMA50 | 134.24 |
| 2 | Daily SMA100 | 139.73 |
| 3 | Daily SMA200 | 136.75 |
The previous day high was 130.58 while the previous day low was 129.27. The daily 38.2% Fib levels comes at 129.77, expected to provide resistance. Similarly, the daily 61.8% fib level is at 130.08, expected to provide resistance.
Note the levels of interest below:
- Pivot support is noted at 129.05, 128.5, 127.73
- Pivot resistance is noted at 130.37, 131.13, 131.68
| Levels | Levels.1 |
|---|---|
| Previous Daily High | 130.58 |
| Previous Daily Low | 129.27 |
| Previous Weekly High | 131.58 |
| Previous Weekly Low | 127.22 |
| Previous Monthly High | 138.18 |
| Previous Monthly Low | 130.57 |
| Daily Fibonacci 38.2% | 129.77 |
| Daily Fibonacci 61.8% | 130.08 |
| Daily Pivot Point S1 | 129.05 |
| Daily Pivot Point S2 | 128.50 |
| Daily Pivot Point S3 | 127.73 |
| Daily Pivot Point R1 | 130.37 |
| Daily Pivot Point R2 | 131.13 |
| Daily Pivot Point R3 | 131.68 |
[/s2If]
Join Our Telegram Group


