#EURUSD @ 1.09190 struggles after six-day uptrend, seesaws near nine-month high., @nehcap view: Limited upside expected (Pivot Orderbook analysis)
…
This is a premium post.
[s2If !current_user_can(access_s2member_level4)]Please register for PREMIUM VERSION HERE to read full post below containing analysis. In case of any error or you think you are not able to read the full post below, please email us at support#nehcap.com [lwa][/s2If] [s2If current_user_can(access_s2member_level4)]
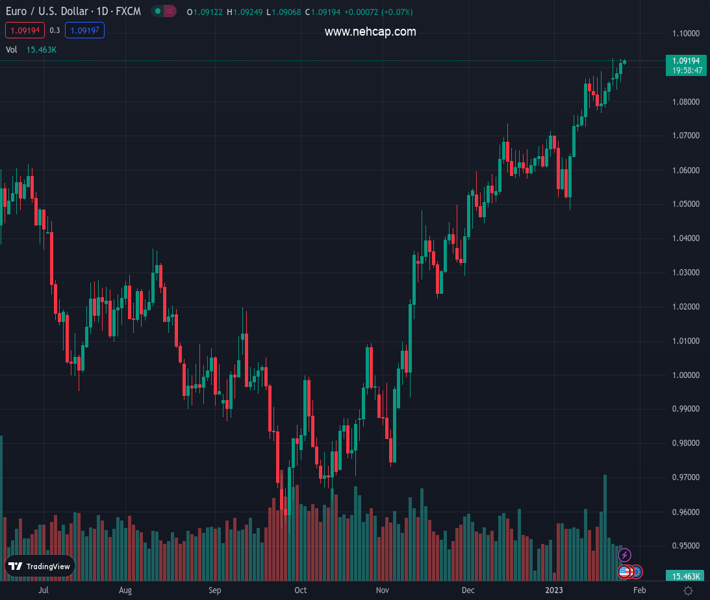
- EUR/USD struggles after six-day uptrend, seesaws near nine-month high.
- Overbought RSI conditions join six-week-old resistance line to challenge further upside.
- Bears need validation from the 10-DMA to retake control.
The pair currently trades last at 1.09190.
The previous day high was 1.0924 while the previous day low was 1.0857. The daily 38.2% Fib levels comes at 1.0898, expected to provide support. Similarly, the daily 61.8% fib level is at 1.0883, expected to provide support.
EUR/USD bounces off intraday low to around 1.0920 as it consolidates weekly gains, the third one in a row, ahead of the US fourth quarter (Q4) Gross Domestic Product (GDP) on Thursday.
The major currency pair justifies the overbought RSI (14) as it prints the first daily loss in seven days.
Not only the Relative Strength Index (RSI) conditions but the ascending trend line from mid-December, near 1.0940 by the press time, also challenges the EUR/USD buyers.
With this, the pair is likely to decline towards the 10-DMA support, close to 1.0850 at the latest. However, any further downside needs to conquer the previous monthly low surrounding 1.0735 to welcome the EUR/USD bears.
Following that, a downward trajectory towards the monthly low near 1.0485 can’t be ruled out.
Meanwhile, an upside break of the aforementioned six-week-long resistance line, around 1.0940, could quickly propel EUR/USD towards the 1.1000 round figure.
Even so, another ascending trend line resistance, from November 15, 2022, could challenge the EUR/USD buyers afterward around 1.1090. It’s worth mentioning that the top marked during late March of the last year, near 1.1185, could jump on the bull’s radar past 1.1090.
To sum up, EUR/USD bulls are likely to take a breather as traders braces for the key data/events. However, the bears are far from the entry.
Trend: Limited upside expected
Technical Levels: Supports and Resistances
EURUSD currently trading at 1.0916 at the time of writing. Pair opened at 1.0914 and is trading with a change of 0.02% % .
| Overview | Overview.1 | |
|---|---|---|
| 0 | Today last price | 1.0916 |
| 1 | Today Daily Change | 0.0002 |
| 2 | Today Daily Change % | 0.02% |
| 3 | Today daily open | 1.0914 |
The pair remains strongly bullish on the daily timeframe. It trades above its 20 SMA @ 1.0751, 50 SMA 1.0603, 100 SMA @ 1.026 and 200 SMA @ 1.0311.
| Trends | Trends.1 | |
|---|---|---|
| 0 | Daily SMA20 | 1.0751 |
| 1 | Daily SMA50 | 1.0603 |
| 2 | Daily SMA100 | 1.0260 |
| 3 | Daily SMA200 | 1.0311 |
The previous day high was 1.0924 while the previous day low was 1.0857. The daily 38.2% Fib levels comes at 1.0898, expected to provide support. Similarly, the daily 61.8% fib level is at 1.0883, expected to provide support.
Note the levels of interest below:
- Pivot support is noted at 1.0873, 1.0832, 1.0807
- Pivot resistance is noted at 1.094, 1.0965, 1.1006
| Levels | Levels.1 |
|---|---|
| Previous Daily High | 1.0924 |
| Previous Daily Low | 1.0857 |
| Previous Weekly High | 1.0888 |
| Previous Weekly Low | 1.0766 |
| Previous Monthly High | 1.0736 |
| Previous Monthly Low | 1.0393 |
| Daily Fibonacci 38.2% | 1.0898 |
| Daily Fibonacci 61.8% | 1.0883 |
| Daily Pivot Point S1 | 1.0873 |
| Daily Pivot Point S2 | 1.0832 |
| Daily Pivot Point S3 | 1.0807 |
| Daily Pivot Point R1 | 1.0940 |
| Daily Pivot Point R2 | 1.0965 |
| Daily Pivot Point R3 | 1.1006 |
[/s2If]
Join Our Telegram Group


