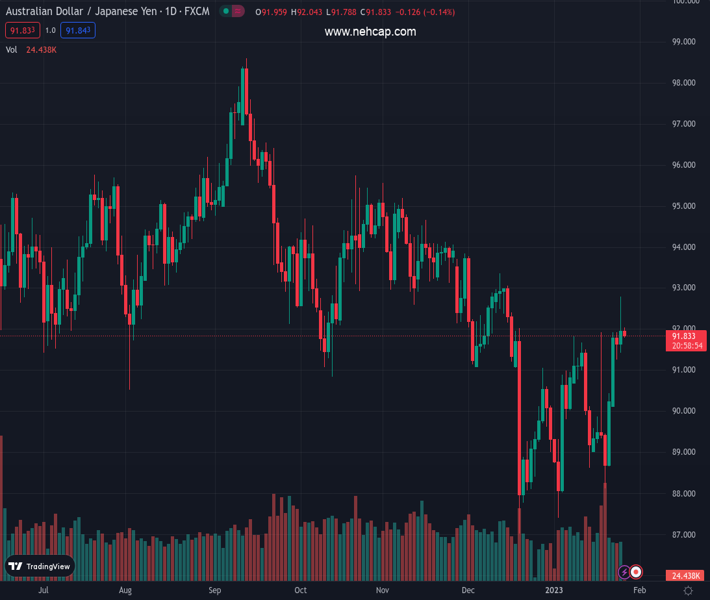
#AUDJPY @ 91.8100 retreats from six-week high, stays pressured near intraday low of late., @nehcap view: Further upside expected (Pivot Orderbook analysis)
…
This is a premium post.
[s2If !current_user_can(access_s2member_level4)]Please register for PREMIUM VERSION HERE to read full post below containing analysis. In case of any error or you think you are not able to read the full post below, please email us at support#nehcap.com [lwa][/s2If] [s2If current_user_can(access_s2member_level4)]
- AUD/JPY retreats from six-week high, stays pressured near intraday low of late.
- 50-SMA pierces off 200-SMA from below to suggest further upside via golden cross.
- Weekly support line guards immediate downside, bulls may aim for monthly ascending trend line.
The pair currently trades last at 91.8100.
The previous day high was 92.79 while the previous day low was 91.42. The daily 38.2% Fib levels comes at 92.27, expected to provide resistance. Similarly, the daily 61.8% fib level is at 91.94, expected to provide resistance.
AUD/JPY takes offers to pare the biggest weekly gains since mid-October around 91.85 during the mid-Asian session on Thursday. In doing so, the cross-currency pair takes a U-turn from the 1.5-month high, marked the previous day, while holding lower grounds near intraday bottom.
The quote’s latest pullback could be linked to its ability to cross an upward-sloping resistance line from the late December, around 92.80. Adding strength to the bearish bias are the red signals from the MACD indicator.
However, a one-week-old ascending trend and the golden cross between the 50-SMA and the 200-SMA challenge the AUD/JPY sellers. That said, the golden cross is a bullish moving average (MA) crossover where the short-term MA crosses the longer-term ones from below and hints.
As a result, the pair buyers before hopeful unless the quote stays beyond the immediate support line, close to 91.50 by the press time.
Following that, a convergence of the stated SMAs near 93.38 appears the key challenge for the AUD/JPY bears before targeting the monthly low of 87.41.
On the flip side, the aforementioned resistance line from December 28, close to 92.80 at the latest, restricts immediate upside of the pair. Adding strength to the stated hurdle is the monthly high.
In a case where the AUD/JPY pair rises past 92.80, the mid-December high near 93.35 and the last monthly peak of 93.81 could lure the bulls.
Trend: Further upside expected
Technical Levels: Supports and Resistances
AUDJPY currently trading at 91.86 at the time of writing. Pair opened at 92.04 and is trading with a change of -0.2 % .
| Overview | Overview.1 | |
|---|---|---|
| 0 | Today last price | 91.86 |
| 1 | Today Daily Change | -0.18 |
| 2 | Today Daily Change % | -0.20 |
| 3 | Today daily open | 92.04 |
The pair is trading above its 20 Daily moving average @ 90.22, above its 50 Daily moving average @ 91.24 , below its 100 Daily moving average @ 92.79 and below its 200 Daily moving average @ 93.05
| Trends | Trends.1 | |
|---|---|---|
| 0 | Daily SMA20 | 90.22 |
| 1 | Daily SMA50 | 91.24 |
| 2 | Daily SMA100 | 92.79 |
| 3 | Daily SMA200 | 93.05 |
The previous day high was 92.79 while the previous day low was 91.42. The daily 38.2% Fib levels comes at 92.27, expected to provide resistance. Similarly, the daily 61.8% fib level is at 91.94, expected to provide resistance.
Note the levels of interest below:
- Pivot support is noted at 91.38, 90.71, 90.01
- Pivot resistance is noted at 92.75, 93.45, 94.12
| Levels | Levels.1 |
|---|---|
| Previous Daily High | 92.79 |
| Previous Daily Low | 91.42 |
| Previous Weekly High | 91.92 |
| Previous Weekly Low | 88.12 |
| Previous Monthly High | 93.81 |
| Previous Monthly Low | 87.02 |
| Daily Fibonacci 38.2% | 92.27 |
| Daily Fibonacci 61.8% | 91.94 |
| Daily Pivot Point S1 | 91.38 |
| Daily Pivot Point S2 | 90.71 |
| Daily Pivot Point S3 | 90.01 |
| Daily Pivot Point R1 | 92.75 |
| Daily Pivot Point R2 | 93.45 |
| Daily Pivot Point R3 | 94.12 |
[/s2If]
Join Our Telegram Group


