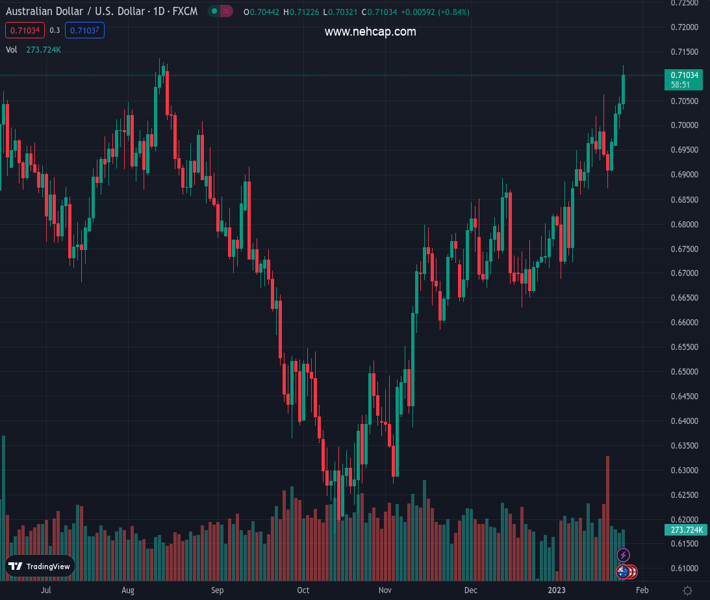
#AUDUSD @ 0.70743 Higher-than-expected Australian inflation data increased the odds of a rate hike by the RBA. (Pivot Orderbook analysis)
…
This is a premium post.
[s2If !current_user_can(access_s2member_level4)]Please register for PREMIUM VERSION HERE to read full post below containing analysis. In case of any error or you think you are not able to read the full post below, please email us at support#nehcap.com [lwa][/s2If] [s2If current_user_can(access_s2member_level4)]
- Higher-than-expected Australian inflation data increased the odds of a rate hike by the RBA.
- Sentiment shifted mixed as Wall Street’s fluctuated between gainers/losers.
- AUD/USD Price Analysis: A daily close above 0.7100 will pave the way for further gains.
The pair currently trades last at 0.70743.
The previous day high was 0.7058 while the previous day low was 0.6993. The daily 38.2% Fib levels comes at 0.7033, expected to provide support. Similarly, the daily 61.8% fib level is at 0.7018, expected to provide support.
The Australian Dollar (AUD) rose to a fresh five-month high at 0.7122 against the US Dollar (USD) on Wednesday, following the release of Australian inflation data that cemented the case for further tightening by the Reserve Bank of Australia (RBA). Except for the Australian Dollar, risk aversion keeps high beta currencies pressured. Hence, the AUD/USD is trading at 0.7106 at the time of writing.
Wall Street shrugs off some of its earlier losses, though it’s a mixed bag with the S&P 500 and Nasdaq posting gains, while the Nasdaq is fluctuating. An absent US economic docket left AUD/USD traders adrift to Australia’s economic data.
Earlier in the Asian session, the Australian Bureau of Statistics revealed that the Consumer Price Index (CPI) surged 1.9% in Q4, above estimates of 1.6%, while the annual rates climbed to 7.8% from 7.3%, its highest level since 1990. Some analysts estimated that the RBA might pause its hiking cycle as global recessionary fears loom. Nevertheless, the CPI report increased the likelihood of a 25 bps rate hike by the RBA at the February 7 meeting, five days after the US Federal Reserve (Fed) monetary policy meeting.
Digging into the report, core trimmed CPI rose by 1.6%, above estimates of 1.4%, while YoY jumped by 6.9%, above the last month’s 6.1%. Therefore, money market futures have begun to price in 50 bps of hikes, implying a peak of 3.60%, compared with 3.40% just before the CPI release.
Consequently, the AUD/USD extended its gains and prepared to test the August 11 daily high of 0.7136, which could soon be the major’s eyes to close above 0.7100.
Technically speaking, the AUD/USD remains upward biased, and if it achieves a daily close above 0.7100, it will open the door for further upside. The case is cemented by oscillators confirming the uptrend. Though shy of overbought conditions, the Relative Strength Index (RSI) continues to aim higher. At the same time, the Rate of Change (RoC) witnessed a volatility jump in two consecutive days, suggesting buyers are moving in.
Therefore, the AUD/USD first resistance would be the August 2022 high of 0.7136. The break above will expose the 0.7150, ahead of the 0.7200 psychological level.
Technical Levels: Supports and Resistances
AUDUSD currently trading at 0.71 at the time of writing. Pair opened at 0.7042 and is trading with a change of 0.82 % .
| Overview | Overview.1 | |
|---|---|---|
| 0 | Today last price | 0.7100 |
| 1 | Today Daily Change | 0.0058 |
| 2 | Today Daily Change % | 0.8200 |
| 3 | Today daily open | 0.7042 |
The pair remains strongly bullish on the daily timeframe. It trades above its 20 SMA @ 0.689, 50 SMA 0.6792, 100 SMA @ 0.6646 and 200 SMA @ 0.6816.
| Trends | Trends.1 | |
|---|---|---|
| 0 | Daily SMA20 | 0.6890 |
| 1 | Daily SMA50 | 0.6792 |
| 2 | Daily SMA100 | 0.6646 |
| 3 | Daily SMA200 | 0.6816 |
The previous day high was 0.7058 while the previous day low was 0.6993. The daily 38.2% Fib levels comes at 0.7033, expected to provide support. Similarly, the daily 61.8% fib level is at 0.7018, expected to provide support.
Note the levels of interest below:
- Pivot support is noted at 0.7005, 0.6967, 0.694
- Pivot resistance is noted at 0.7069, 0.7096, 0.7134
| Levels | Levels.1 |
|---|---|
| Previous Daily High | 0.7058 |
| Previous Daily Low | 0.6993 |
| Previous Weekly High | 0.7064 |
| Previous Weekly Low | 0.6872 |
| Previous Monthly High | 0.6893 |
| Previous Monthly Low | 0.6629 |
| Daily Fibonacci 38.2% | 0.7033 |
| Daily Fibonacci 61.8% | 0.7018 |
| Daily Pivot Point S1 | 0.7005 |
| Daily Pivot Point S2 | 0.6967 |
| Daily Pivot Point S3 | 0.6940 |
| Daily Pivot Point R1 | 0.7069 |
| Daily Pivot Point R2 | 0.7096 |
| Daily Pivot Point R3 | 0.7134 |
[/s2If]
Join Our Telegram Group
")


