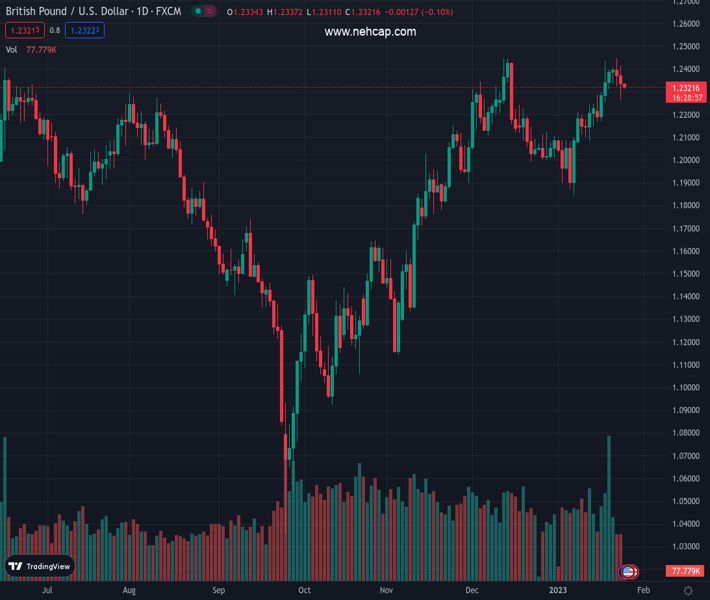
#GBPUSD @ 1.23228 struggles for clear directions after two-day downtrend. (Pivot Orderbook analysis)
…
This is a premium post.
[s2If !current_user_can(access_s2member_level4)]Please register for PREMIUM VERSION HERE to read full post below containing analysis. In case of any error or you think you are not able to read the full post below, please email us at support#nehcap.com [lwa][/s2If] [s2If current_user_can(access_s2member_level4)]
- GBP/USD struggles for clear directions after two-day downtrend.
- UK’s record deficit, fresh Brexit woes and fears of strong recession due to workers’ strikes favor bears.
- Receding hawkish concerns surrounding Fed, downbeat US data put a floor under the Cable price.
- Second-tier UK data may entertain traders ahead of US Q4 GDP.
The pair currently trades last at 1.23228.
The previous day high was 1.2414 while the previous day low was 1.2263. The daily 38.2% Fib levels comes at 1.2321, expected to provide support. Similarly, the daily 61.8% fib level is at 1.2356, expected to provide resistance.
GBP/USD holds lower ground near 1.2320 as bears seek more clues to rule further heading into Wednesday’s London open. In doing so, the Cable pair remains sidelined after a two-day downtrend while copying the broad market inaction.
In addition to a lack of liquidity in the markets, receding hawkish hopes from both the Bank of England (BoE) and the Federal Reserve (Fed) also seems to limit the quote’s latest moves.
As per the latest Reuters Poll, the BoE has a gap for only two rate hikes worth 0.25% before hitting the pivot level. On the other hand, “Fed fund futures see only two more quarter-point rate hikes by the Fed to a peak of around 5% by June, before it starts cutting rates later in the year. The Federal Reserve itself has insisted it still has 75 bps of increases in the pipeline,” said Reuters.
Additionally, downbeat prints of both the UK and the US activity data for January failed to provide any clear directions for the Cable pair traders.
It’s worth noting, however, that the various stimulus and energy payments have led to the UK’s record deficit but couldn’t solve the workers’ problem in Britain, both of which signal more negatives for the GBP/USD pair. Additionally, the talks of the sustained disagreement between the UK and Europe over Brexit also lure the pair sellers.
On the other hand, US recession woes are on the table and hence the US Dollar trades dicey ahead of the US Gross Domestic Product (GDP) for the fourth quarter (Q4) and the next week’s Federal Open Market Committee (FOMC) meeting.
Amid these plays, US Treasury bond yields remain inactive after Tuesday’s pullback while the S&P 500 Futures print mild losses but the stocks in the Asia-Pacific region trade mixed and support the currencies of the zone.
Looking forward, the UK Producer Price Index (PPI) details for January may entertain GBP/USD traders ahead of Thursday’s key US Q4 GDP and the next week’s Fed meeting.
A daily closing below the 13-day-old support line, now resistance around 1.2350, keeps GBP/USD bears hopeful.
Technical Levels: Supports and Resistances
GBPUSD currently trading at 1.2321 at the time of writing. Pair opened at 1.2335 and is trading with a change of -0.11% % .
| Overview | Overview.1 | |
|---|---|---|
| 0 | Today last price | 1.2321 |
| 1 | Today Daily Change | -0.0014 |
| 2 | Today Daily Change % | -0.11% |
| 3 | Today daily open | 1.2335 |
The pair remains strongly bullish on the daily timeframe. It trades above its 20 SMA @ 1.2174, 50 SMA 1.2132, 100 SMA @ 1.1741 and 200 SMA @ 1.1972.
| Trends | Trends.1 | |
|---|---|---|
| 0 | Daily SMA20 | 1.2174 |
| 1 | Daily SMA50 | 1.2132 |
| 2 | Daily SMA100 | 1.1741 |
| 3 | Daily SMA200 | 1.1972 |
The previous day high was 1.2414 while the previous day low was 1.2263. The daily 38.2% Fib levels comes at 1.2321, expected to provide support. Similarly, the daily 61.8% fib level is at 1.2356, expected to provide resistance.
Note the levels of interest below:
- Pivot support is noted at 1.2261, 1.2187, 1.211
- Pivot resistance is noted at 1.2412, 1.2488, 1.2562
| Levels | Levels.1 |
|---|---|
| Previous Daily High | 1.2414 |
| Previous Daily Low | 1.2263 |
| Previous Weekly High | 1.2436 |
| Previous Weekly Low | 1.2169 |
| Previous Monthly High | 1.2447 |
| Previous Monthly Low | 1.1992 |
| Daily Fibonacci 38.2% | 1.2321 |
| Daily Fibonacci 61.8% | 1.2356 |
| Daily Pivot Point S1 | 1.2261 |
| Daily Pivot Point S2 | 1.2187 |
| Daily Pivot Point S3 | 1.2110 |
| Daily Pivot Point R1 | 1.2412 |
| Daily Pivot Point R2 | 1.2488 |
| Daily Pivot Point R3 | 1.2562 |
[/s2If]
Join Our Telegram Group
")


