#EURJPY @ 140.724 has delivered a perpendicular north-side move on the unchanged BoJ policy. (Pivot Orderbook analysis)
…
This is a premium post.
[s2If !current_user_can(access_s2member_level4)]Please register for PREMIUM VERSION HERE to read full post below containing analysis. In case of any error or you think you are not able to read the full post below, please email us at support#nehcap.com [lwa][/s2If] [s2If current_user_can(access_s2member_level4)]
- EUR/JPY has delivered a perpendicular north-side move on the unchanged BoJ policy.
- BoJ Kuroda has kept the interest rate unchanged at -0.1% and the 10-year JGBs target at around 0%.
- The cross has surpassed the 200-period EMA at 140.00 in one go and is expected to extend gains further.
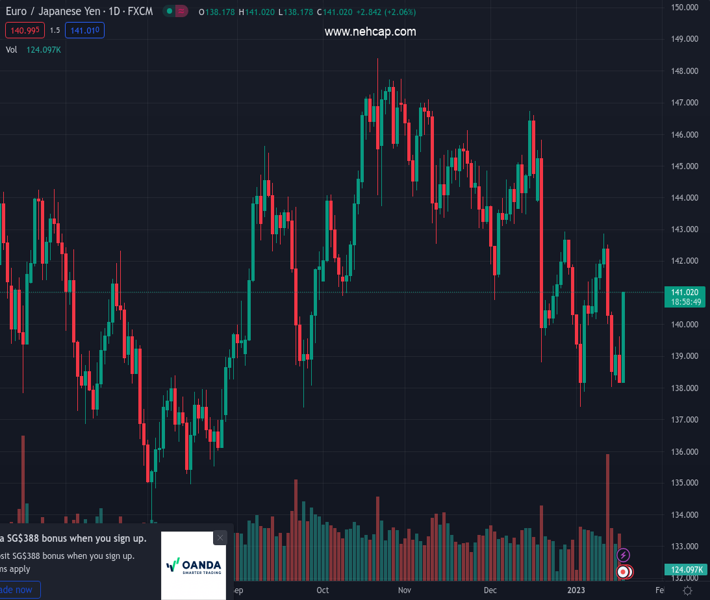
The pair currently trades last at 140.724.
The previous day high was 139.62 while the previous day low was 138.2. The daily 38.2% Fib levels comes at 138.74, expected to provide support. Similarly, the daily 61.8% fib level is at 139.08, expected to provide support.
The EUR/JPY pair has displayed a juggernaut run as the Bank of Japan (BOJ) has kept the monetary policy unchanged. BoJ Governor Haruhiko Kuroda has kept the interest rate unchanged at -0.1% and the 10-year Japan Government bonds (JGBs) target at around 0%.
Investors are expecting cues about an exit from the decade-long ultra-easy monetary policy, however, an unchanged policy stance has weakened the Japanese Yen.
On an hourly scale, EUR/JPUY has recovered dramatically after forming a Triple Bottom chart pattern. The formation of the aforementioned chart pattern around 138.00 is demonstrating a sheer bullish reversal. The cross has surpassed the 200-period Exponential Moving Average (EMA) at 140.00 in one go and is expected to extend gains further, considering the momentum in the north-side move.
The Relative Strength Index (RSI) (14) has aggressively entered into the bullish range of 60.00-80.00, which indicates more upside ahead.
After a run-up, a minor corrective move to near January 5 low at 139.97 will be a decent opportunity of bargain buy for the market participants, which will drive the asset towards January 6 high at 141.45 followed by December 28 high around 143.00.
On the flip side, a downside move below the previous week’s low at 138.00 will drag the cross towards January 3 low at 137.39. A slippage below the latter will expose the asset for more downside towards April 14 low at 135.51.
Technical Levels: Supports and Resistances
EURJPY currently trading at 140.5 at the time of writing. Pair opened at 138.38 and is trading with a change of 1.53 % .
| Overview | Overview.1 | |
|---|---|---|
| 0 | Today last price | 140.50 |
| 1 | Today Daily Change | 2.12 |
| 2 | Today Daily Change % | 1.53 |
| 3 | Today daily open | 138.38 |
The pair remains strongly bearish on the daily time frame. It trades below the 20 SMA @ 140.58, 50 SMA 142.75, 100 SMA @ 143.14 and 200 SMA @ 140.73.
| Trends | Trends.1 | |
|---|---|---|
| 0 | Daily SMA20 | 140.58 |
| 1 | Daily SMA50 | 142.75 |
| 2 | Daily SMA100 | 143.14 |
| 3 | Daily SMA200 | 140.73 |
The previous day high was 139.62 while the previous day low was 138.2. The daily 38.2% Fib levels comes at 138.74, expected to provide support. Similarly, the daily 61.8% fib level is at 139.08, expected to provide support.
Note the levels of interest below:
- Pivot support is noted at 137.85, 137.32, 136.43
- Pivot resistance is noted at 139.27, 140.15, 140.69
| Levels | Levels.1 |
|---|---|
| Previous Daily High | 139.62 |
| Previous Daily Low | 138.20 |
| Previous Weekly High | 142.86 |
| Previous Weekly Low | 138.01 |
| Previous Monthly High | 146.73 |
| Previous Monthly Low | 138.80 |
| Daily Fibonacci 38.2% | 138.74 |
| Daily Fibonacci 61.8% | 139.08 |
| Daily Pivot Point S1 | 137.85 |
| Daily Pivot Point S2 | 137.32 |
| Daily Pivot Point S3 | 136.43 |
| Daily Pivot Point R1 | 139.27 |
| Daily Pivot Point R2 | 140.15 |
| Daily Pivot Point R3 | 140.69 |
[/s2If]
Join Our Telegram Group
")


