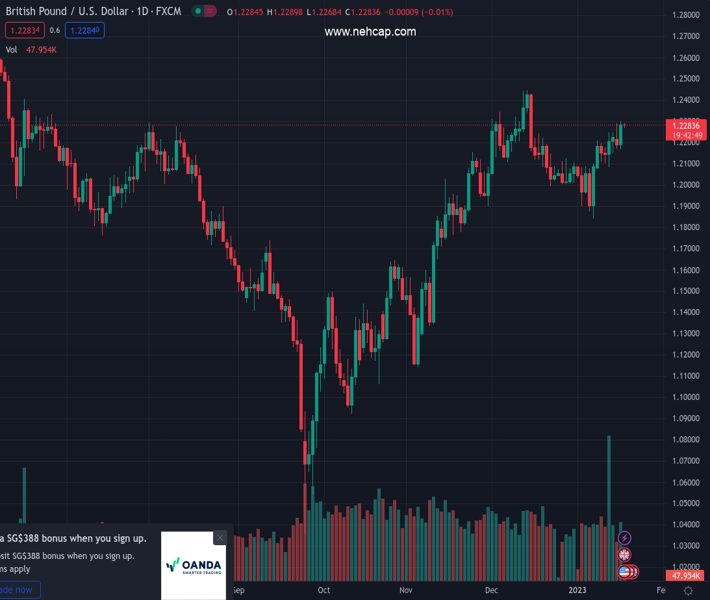
#GBPUSD @ 1.22834 grinds near five-week high inside bearish chart formation., @nehcap view: Further downside expected (Pivot Orderbook analysis)
…
This is a premium post.
[s2If !current_user_can(access_s2member_level4)]Please register for PREMIUM VERSION HERE to read full post below containing analysis. In case of any error or you think you are not able to read the full post below, please email us at support#nehcap.com [lwa][/s2If] [s2If current_user_can(access_s2member_level4)]
- GBP/USD grinds near five-week high inside bearish chart formation.
- Divergence between higher-high on prices and lower high on RSI (14) tease sellers.
- Upside break of 1.2345 could defy the bearish signals and challenge previous monthly top.
- UK Inflation may disappoint pair buyers amid mixed forecasts.
The pair currently trades last at 1.22834.
The previous day high was 1.23 while the previous day low was 1.2169. The daily 38.2% Fib levels comes at 1.225, expected to provide support. Similarly, the daily 61.8% fib level is at 1.2219, expected to provide support.
GBP/USD picks up bids to defend the previous day’s run-up around the 1.2300 round figure, despite posting only 0.08% intraday gains, as the Cable pair traders await the UK’s key inflation data on early Wednesday. Even so, the quote stays inside an eight-day-old rising wedge bearish chart formation.
Not only the rising wedge but bearish RSI (14) divergence also keeps the GBP/USD sellers hopeful. That said, the oscillator’s inability to back the higher-high on prices portrays the bearish RSI divergence.
However, the quote’s current upside could lure GBP/USD buyers if the scheduled UK data offers a positive surprise and allow the pair to cross the stated wedge’s upper line, close to 1.2325 by the press time.
Following that, the mid-December 2022 low around 1.2345 may probe GBP/USD bulls before directing them toward the previous monthly peak surrounding 1.2445.
Alternatively, pullback moves need validation from the 200-SMA level of 1.2153 while the aforementioned wedge’s lower line, near 1.2200 at the latest, restricts the quote’s immediate downside.
It’s worth noting, however, that the GBP/USD weakness past 1.2153 won’t hesitate to refresh the monthly low, currently around 1.1840.
Trend: Further downside expected
Technical Levels: Supports and Resistances
GBPUSD currently trading at 1.2285 at the time of writing. Pair opened at 1.2279 and is trading with a change of 0.05% % .
| Overview | Overview.1 | |
|---|---|---|
| 0 | Today last price | 1.2285 |
| 1 | Today Daily Change | 0.0006 |
| 2 | Today Daily Change % | 0.05% |
| 3 | Today daily open | 1.2279 |
The pair remains strongly bullish on the daily timeframe. It trades above its 20 SMA @ 1.2095, 50 SMA 1.2066, 100 SMA @ 1.1699 and 200 SMA @ 1.1989.
| Trends | Trends.1 | |
|---|---|---|
| 0 | Daily SMA20 | 1.2095 |
| 1 | Daily SMA50 | 1.2066 |
| 2 | Daily SMA100 | 1.1699 |
| 3 | Daily SMA200 | 1.1989 |
The previous day high was 1.23 while the previous day low was 1.2169. The daily 38.2% Fib levels comes at 1.225, expected to provide support. Similarly, the daily 61.8% fib level is at 1.2219, expected to provide support.
Note the levels of interest below:
- Pivot support is noted at 1.2199, 1.2119, 1.2069
- Pivot resistance is noted at 1.233, 1.238, 1.246
| Levels | Levels.1 |
|---|---|
| Previous Daily High | 1.2300 |
| Previous Daily Low | 1.2169 |
| Previous Weekly High | 1.2249 |
| Previous Weekly Low | 1.2086 |
| Previous Monthly High | 1.2447 |
| Previous Monthly Low | 1.1992 |
| Daily Fibonacci 38.2% | 1.2250 |
| Daily Fibonacci 61.8% | 1.2219 |
| Daily Pivot Point S1 | 1.2199 |
| Daily Pivot Point S2 | 1.2119 |
| Daily Pivot Point S3 | 1.2069 |
| Daily Pivot Point R1 | 1.2330 |
| Daily Pivot Point R2 | 1.2380 |
| Daily Pivot Point R3 | 1.2460 |
[/s2If]
Join Our Telegram Group
")


