#XAUUSD @ 1,907.47 Gold price is oscillating above $1,900.00, however, the downside seems favored amid soaring yields. (Pivot Orderbook analysis)
…
This is a premium post.
[s2If !current_user_can(access_s2member_level4)]Please register for PREMIUM VERSION HERE to read full post below containing analysis. In case of any error or you think you are not able to read the full post below, please email us at support#nehcap.com [lwa][/s2If] [s2If current_user_can(access_s2member_level4)]
- Gold price is oscillating above $1,900.00, however, the downside seems favored amid soaring yields.
- Fed Barkin cited that backing off from interest rate hiking too soon is not favorable.
- Higher monthly US Retail Sales data might rebound inflation projections.
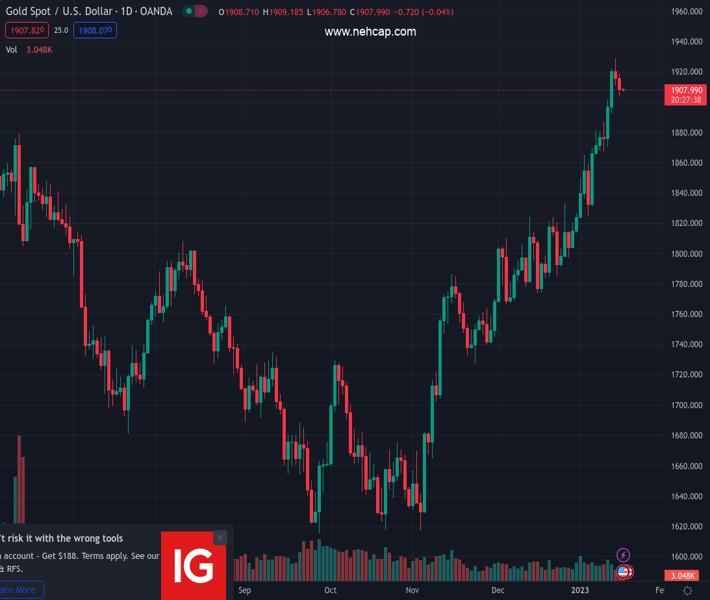
The pair currently trades last at 1907.47.
The previous day high was 1919.16 while the previous day low was 1903.79. The daily 38.2% Fib levels comes at 1909.66, expected to provide resistance. Similarly, the daily 61.8% fib level is at 1913.29, expected to provide resistance.
Gold price (XAU/USD) is displaying a sideways auction profile above the round-level support of $1,900.00 in the Asian session. The precious metal is managing to sustain above $1,900.00, however, the downside seems supportive amid rising US Treasury yields after the hawkish commentary from Richmond Federal Reserve (Fed) Bank, President, Tom Barkin.
Fed policymaker cited that the economy has passed the phase of inflation peak but we are still far from the median Consumer Price Index (CPI). Therefore, backing off from interest rate hiking too soon is not favorable.
Meanwhile, volatility in the market is escalating as risk-perceived assets are losing traction. S&P500 futures have accelerated their losses, indicating strength in the risk-aversion theme. A decline in the risk appetite of the market participants has also weakened the demand for US government bonds. This has led to an increment in the 10-year US Treasury yields above 3.54%.
Going forward, investors will focus on the United States Producer Price Index (PPI) (Dec) and monthly Retail Sales (Dec) data. As per the estimates, the headline PPI (Dec) is seen lower at 6.8% while the core PPI is seen declining to 5.9%. Apart from that, monthly Retail Sales data might show an expansion of 0.1% vs. the contraction of 0.6% released earlier. Improvement in Retail Sales data might bolster the odds of a rebound in inflation projections.
Gold price is demonstrating the formation of Lower Highs on an hourly scale, communicating signs of bearish reversal. The precious metal might display sheer weakness after breaking the horizontal support plotted from Tuesday’s low marginally below $1,905.00.
The 20-and 50-period Exponential Moving Averages (EMAs) are on the verge of delivering a bearish cross over around $1,909.00.
The Relative Strength Index (RSI) (14) is oscillating in a 40.00-60.00 range. A slippage into the bearish range of 20.00-40.00 will activate a bearish momentum.
Technical Levels: Supports and Resistances
XAUUSD currently trading at 1907.68 at the time of writing. Pair opened at 1909.19 and is trading with a change of -0.08 % .
| Overview | Overview.1 | |
|---|---|---|
| 0 | Today last price | 1907.68 |
| 1 | Today Daily Change | -1.51 |
| 2 | Today Daily Change % | -0.08 |
| 3 | Today daily open | 1909.19 |
The pair remains strongly bullish on the daily timeframe. It trades above its 20 SMA @ 1847.16, 50 SMA 1801.78, 100 SMA @ 1737.71 and 200 SMA @ 1776.73.
| Trends | Trends.1 | |
|---|---|---|
| 0 | Daily SMA20 | 1847.16 |
| 1 | Daily SMA50 | 1801.78 |
| 2 | Daily SMA100 | 1737.71 |
| 3 | Daily SMA200 | 1776.73 |
The previous day high was 1919.16 while the previous day low was 1903.79. The daily 38.2% Fib levels comes at 1909.66, expected to provide resistance. Similarly, the daily 61.8% fib level is at 1913.29, expected to provide resistance.
Note the levels of interest below:
- Pivot support is noted at 1902.27, 1895.34, 1886.9
- Pivot resistance is noted at 1917.64, 1926.08, 1933.01
| Levels | Levels.1 |
|---|---|
| Previous Daily High | 1919.16 |
| Previous Daily Low | 1903.79 |
| Previous Weekly High | 1921.96 |
| Previous Weekly Low | 1865.22 |
| Previous Monthly High | 1833.38 |
| Previous Monthly Low | 1765.89 |
| Daily Fibonacci 38.2% | 1909.66 |
| Daily Fibonacci 61.8% | 1913.29 |
| Daily Pivot Point S1 | 1902.27 |
| Daily Pivot Point S2 | 1895.34 |
| Daily Pivot Point S3 | 1886.90 |
| Daily Pivot Point R1 | 1917.64 |
| Daily Pivot Point R2 | 1926.08 |
| Daily Pivot Point R3 | 1933.01 |
[/s2If]
Join Our Telegram Group
")


