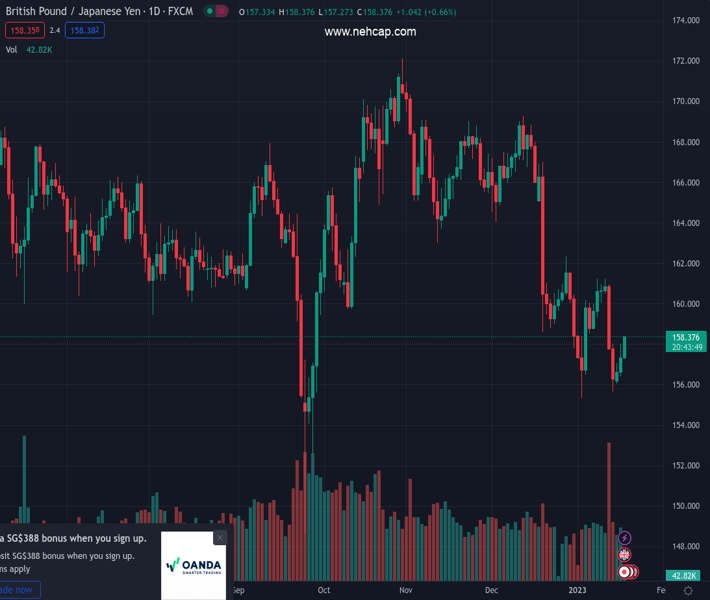
#GBPJPY @ 158.313 picks up bids to portray three-day winning streak., @nehcap view: Limited upside expected (Pivot Orderbook analysis)
…
This is a premium post.
[s2If !current_user_can(access_s2member_level4)]Please register for PREMIUM VERSION HERE to read full post below containing analysis. In case of any error or you think you are not able to read the full post below, please email us at support#nehcap.com [lwa][/s2If] [s2If current_user_can(access_s2member_level4)]
- GBP/JPY picks up bids to portray three-day winning streak.
- Upbeat oscillators back further recovery but key SMA confluence, monthly resistance line challenge upside momentum.
- Bears need validation from 155.00 to retake control.
The pair currently trades last at 158.313.
The previous day high was 158.03 while the previous day low was 156.4. The daily 38.2% Fib levels comes at 157.41, expected to provide support. Similarly, the daily 61.8% fib level is at 157.02, expected to provide support.
GBP/JPY bulls attack 158.00 during the three-day uptrend amid early Wednesday. In doing so, the cross-currency pair portrays the broad Yen weakness ahead of the key Bank of Japan (BoJ) monetary policy meeting decision, as well as the British Pound’s (GBP) strength before the UK Consumer Price Index (CPI) release.
It’s worth noting that the quote’s upside momentum joins the upside RSI (14), not overbought, as well as the bullish MACD signals, to suggest that the buyers have more time to keep the reins.
However, a convergence of the 50-Simple Moving Average (SMA) and the 100-SMA, around 158.80-159.00, appears a tough nut to crack for the GBP/JPY bulls.
Even if the pair rises past 159.00, a downward-sloping resistance line from early December, close to 159.40 by the press time, will precede the 160.00 round figure to probe the buyers.
Following that, a run-up towards a three-week-old resistance line near 160.65 can’t be ruled out.
Alternatively, pullback moves remain elusive unless the GBP/JPY pair stays beyond the weekly support line, around 156.90 by the press time.
Should the quote drops below 156.90, lows marked on Friday and during late December, respectively around 155.60 and 155.35, could challenge the GBP/JPY bears.
Trend: Limited upside expected
Technical Levels: Supports and Resistances
GBPJPY currently trading at 158.12 at the time of writing. Pair opened at 157.43 and is trading with a change of 0.44% % .
| Overview | Overview.1 | |
|---|---|---|
| 0 | Today last price | 158.12 |
| 1 | Today Daily Change | 0.69 |
| 2 | Today Daily Change % | 0.44% |
| 3 | Today daily open | 157.43 |
The pair remains strongly bearish on the daily time frame. It trades below the 20 SMA @ 159.23, 50 SMA 163.56, 100 SMA @ 164.08 and 200 SMA @ 163.59.
| Trends | Trends.1 | |
|---|---|---|
| 0 | Daily SMA20 | 159.23 |
| 1 | Daily SMA50 | 163.56 |
| 2 | Daily SMA100 | 164.08 |
| 3 | Daily SMA200 | 163.59 |
The previous day high was 158.03 while the previous day low was 156.4. The daily 38.2% Fib levels comes at 157.41, expected to provide support. Similarly, the daily 61.8% fib level is at 157.02, expected to provide support.
Note the levels of interest below:
- Pivot support is noted at 156.54, 155.66, 154.91
- Pivot resistance is noted at 158.18, 158.92, 159.81
| Levels | Levels.1 |
|---|---|
| Previous Daily High | 158.03 |
| Previous Daily Low | 156.40 |
| Previous Weekly High | 161.24 |
| Previous Weekly Low | 155.65 |
| Previous Monthly High | 169.28 |
| Previous Monthly Low | 157.84 |
| Daily Fibonacci 38.2% | 157.41 |
| Daily Fibonacci 61.8% | 157.02 |
| Daily Pivot Point S1 | 156.54 |
| Daily Pivot Point S2 | 155.66 |
| Daily Pivot Point S3 | 154.91 |
| Daily Pivot Point R1 | 158.18 |
| Daily Pivot Point R2 | 158.92 |
| Daily Pivot Point R3 | 159.81 |
[/s2If]
Join Our Telegram Group
")


