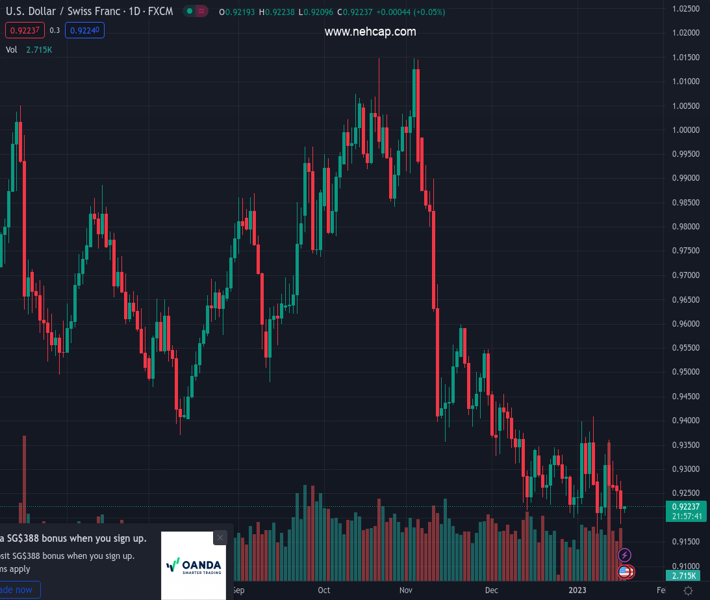
#USDCHF @ 0.92221 holds lower grounds after posting the biggest daily loss in over a week. (Pivot Orderbook analysis)
…
This is a premium post.
[s2If !current_user_can(access_s2member_level4)]Please register for PREMIUM VERSION HERE to read full post below containing analysis. In case of any error or you think you are not able to read the full post below, please email us at support#nehcap.com [lwa][/s2If] [s2If current_user_can(access_s2member_level4)]
- USD/CHF holds lower grounds after posting the biggest daily loss in over a week.
- Softer US data probed US Dollar buyers even as upbeat yields, downbeat EUR probed greenback bears.
- Mixed sentiment, dovish Fed talks highlight the need for softer US data to keep USD/CHF bears on the table.
The pair currently trades last at 0.92221.
The previous day high was 0.9288 while the previous day low was 0.9219. The daily 38.2% Fib levels comes at 0.9262, expected to provide resistance. Similarly, the daily 61.8% fib level is at 0.9245, expected to provide resistance.
USD/CHF remains depressed as sellers approach the 0.9200 threshold, close to 0.9215 during the early hours of Wednesday’s Asian session. In doing so, the Swiss currency (CHF) pair cheers the US Dollar’s failure to benefit from upbeat Treasury bond yields and the softer Euro amid softer US data, as well as downbeat comments from the Federal Reserve (Fed) officials.
On Tuesday, the US Dollar Index (DXY) marked a dismal closing around 102.35, after an initially positive performance. That said, the US Treasury bond yields allowed the US Dollar to remain firmer, downbeat prints of the New York manufacturing data, namely the Empire State Manufacturing Index for December, probed the US Dollar bulls and put a floor under the Gold price. That said, the NY Fed’s business gauge dropped sharply in January to -32.9 versus -4.5 market forecasts and -11.2 prior readings.
The data also helped the Federal Reserve Bank of Richmond’s President and CEO Thomas Barkin to state, “My hope is that we have passed the peak of inflation.” As a result, the US Dollar bulls had a tough ride.
It’s worth noting that the dovish concerns surrounding the ECB’s next move, which weighed on the Euro, could be linked to Bloomberg’s news saying, “ECB policymakers are starting to consider a slower pace of interest-rate hikes after a likely 50 basis-point step in February.”
Amid these plays, Wall Street closed mixed and the benchmark 10-year US Treasury bond yields ended the day with nearly four basis points (bps) of an upside to 3.55% even as the two-year counterpart retreated to 4.20%.
Moving on, mixed signals from the recently mixed US consumer-centric data, coupled with the Federal Reserve (Fed) policymakers’ inability to defend the hawkish bias, highlight today’s US Retail Sales and the Producer Price Index (PPI) for December. Forecasts suggest that the headlines US Retail Sales may improve with 0.1% monthly gains, versus the previous contraction of 0.6% while the PPI is likely to ease to -0.1% from 0.3% prior.
USD/CHF is well-set to refresh the monthly low, around 0.9165 by the press time, unless the quote crosses a two-week-old resistance line, close to 0.9315 at the latest.
Technical Levels: Supports and Resistances
USDCHF currently trading at 0.9218 at the time of writing. Pair opened at 0.9263 and is trading with a change of -0.49 % .
| Overview | Overview.1 | |
|---|---|---|
| 0 | Today last price | 0.9218 |
| 1 | Today Daily Change | -0.0045 |
| 2 | Today Daily Change % | -0.4900 |
| 3 | Today daily open | 0.9263 |
The pair remains strongly bearish on the daily time frame. It trades below the 20 SMA @ 0.9284, 50 SMA 0.9385, 100 SMA @ 0.962 and 200 SMA @ 0.9643.
| Trends | Trends.1 | |
|---|---|---|
| 0 | Daily SMA20 | 0.9284 |
| 1 | Daily SMA50 | 0.9385 |
| 2 | Daily SMA100 | 0.9620 |
| 3 | Daily SMA200 | 0.9643 |
The previous day high was 0.9288 while the previous day low was 0.9219. The daily 38.2% Fib levels comes at 0.9262, expected to provide resistance. Similarly, the daily 61.8% fib level is at 0.9245, expected to provide resistance.
Note the levels of interest below:
- Pivot support is noted at 0.9225, 0.9187, 0.9155
- Pivot resistance is noted at 0.9295, 0.9326, 0.9364
| Levels | Levels.1 |
|---|---|
| Previous Daily High | 0.9288 |
| Previous Daily Low | 0.9219 |
| Previous Weekly High | 0.9363 |
| Previous Weekly Low | 0.9167 |
| Previous Monthly High | 0.9471 |
| Previous Monthly Low | 0.9201 |
| Daily Fibonacci 38.2% | 0.9262 |
| Daily Fibonacci 61.8% | 0.9245 |
| Daily Pivot Point S1 | 0.9225 |
| Daily Pivot Point S2 | 0.9187 |
| Daily Pivot Point S3 | 0.9155 |
| Daily Pivot Point R1 | 0.9295 |
| Daily Pivot Point R2 | 0.9326 |
| Daily Pivot Point R3 | 0.9364 |
[/s2If]
Join Our Telegram Group
")


