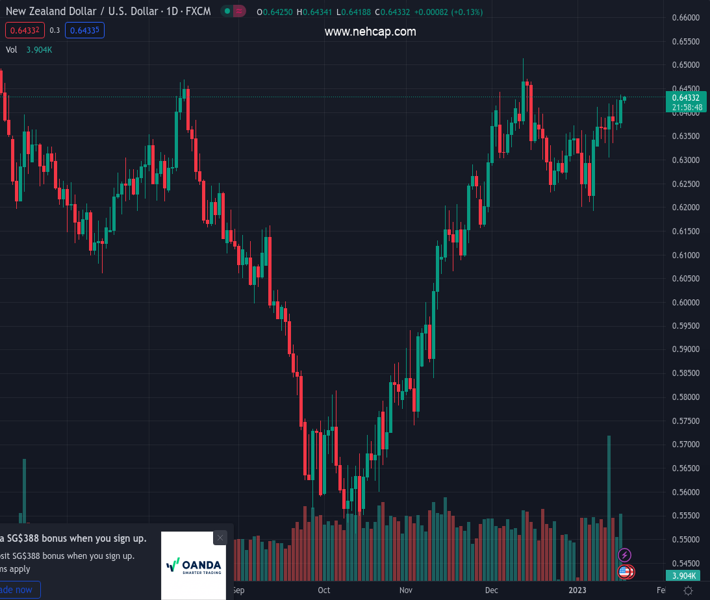
#NZDUSD @ 0.64307 Fed Barkin’s hawkish commentary on interest rates has failed to impact the Kiwi asset. (Pivot Orderbook analysis)
…
This is a premium post.
[s2If !current_user_can(access_s2member_level4)]Please register for PREMIUM VERSION HERE to read full post below containing analysis. In case of any error or you think you are not able to read the full post below, please email us at support#nehcap.com [lwa][/s2If] [s2If current_user_can(access_s2member_level4)]
- Fed Barkin’s hawkish commentary on interest rates has failed to impact the Kiwi asset.
- A breakout of the Bullish Pennant pattern has strengthened the New Zealand Dollar.
- Range shift from the RSI (14) into the 60.00-80.00 territory, will trigger a bullish momentum.
The pair currently trades last at 0.64307.
The previous day high was 0.6427 while the previous day low was 0.6361. The daily 38.2% Fib levels comes at 0.6386, expected to provide support. Similarly, the daily 61.8% fib level is at 0.6402, expected to provide support.
The NZD/USD pair is juggling in a narrow range of around 0.6430 in the early Asian session. The Kiwi asset has turned sideways after refreshing the monthly high at 0.6437 despite the risk-off market mood. S&P500 futures are displaying more losses, portraying a further decline in investors’ risk appetite after hawkish commentary from Richmond Federal Reserve (Fed) Bank President Tom Barkin.
The US Dollar Index (DXY) has turned sideways around 102.00 after a V-shape recovery and is expected to extend gains amid a risk-aversion theme. Also, rising 10-year US Treasury yields are likely to infuse fresh blood into the safe-haven assets.
NZD/USD has delivered a breakout of the Bullish Pennant chart pattern that indicates a continuation of the upside momentum after consolidation on an hourly scale. Usually, the consolidation phase of the chart pattern serves as an inventory adjustment in which those participants initiate longs, which prefer to enter an auction after the establishment of a bullish bias.
The 20-and 50-period Exponential Moving Averages (EMAs) at 0.6415 and 0.6401 respectively have resumed their upside journey, which adds to the upside filters.
Meanwhile, the Relative Strength Index (RSI) (14) is still struggling to shift into the bullish range of 60.00-80.00. An occurrence of the same will trigger a bullish momentum.
For further upside, the Kiwi asset needs to break above Tuesday’s high at 0.6439, which will drive the asset towards December 15 high at 0.6470 followed by December 13 high at 0.6514.
Alternatively, a break below Monday’s low at 0.6361 will weaken the New Zealand Dollar and will drag the Kiwi asset towards January 12 low at 0.6304. A slippage below the latter will expose the asset for more downside toward December 28 low at 0.6263.
Technical Levels: Supports and Resistances
NZDUSD currently trading at 0.6431 at the time of writing. Pair opened at 0.638 and is trading with a change of 0.8 % .
| Overview | Overview.1 | |
|---|---|---|
| 0 | Today last price | 0.6431 |
| 1 | Today Daily Change | 0.0051 |
| 2 | Today Daily Change % | 0.8000 |
| 3 | Today daily open | 0.6380 |
The pair remains strongly bullish on the daily timeframe. It trades above its 20 SMA @ 0.6324, 50 SMA 0.6276, 100 SMA @ 0.6051 and 200 SMA @ 0.6208.
| Trends | Trends.1 | |
|---|---|---|
| 0 | Daily SMA20 | 0.6324 |
| 1 | Daily SMA50 | 0.6276 |
| 2 | Daily SMA100 | 0.6051 |
| 3 | Daily SMA200 | 0.6208 |
The previous day high was 0.6427 while the previous day low was 0.6361. The daily 38.2% Fib levels comes at 0.6386, expected to provide support. Similarly, the daily 61.8% fib level is at 0.6402, expected to provide support.
Note the levels of interest below:
- Pivot support is noted at 0.6351, 0.6323, 0.6285
- Pivot resistance is noted at 0.6417, 0.6455, 0.6484
| Levels | Levels.1 |
|---|---|
| Previous Daily High | 0.6427 |
| Previous Daily Low | 0.6361 |
| Previous Weekly High | 0.6418 |
| Previous Weekly Low | 0.6314 |
| Previous Monthly High | 0.6514 |
| Previous Monthly Low | 0.6230 |
| Daily Fibonacci 38.2% | 0.6386 |
| Daily Fibonacci 61.8% | 0.6402 |
| Daily Pivot Point S1 | 0.6351 |
| Daily Pivot Point S2 | 0.6323 |
| Daily Pivot Point S3 | 0.6285 |
| Daily Pivot Point R1 | 0.6417 |
| Daily Pivot Point R2 | 0.6455 |
| Daily Pivot Point R3 | 0.6484 |
[/s2If]
Join Our Telegram Group
")


