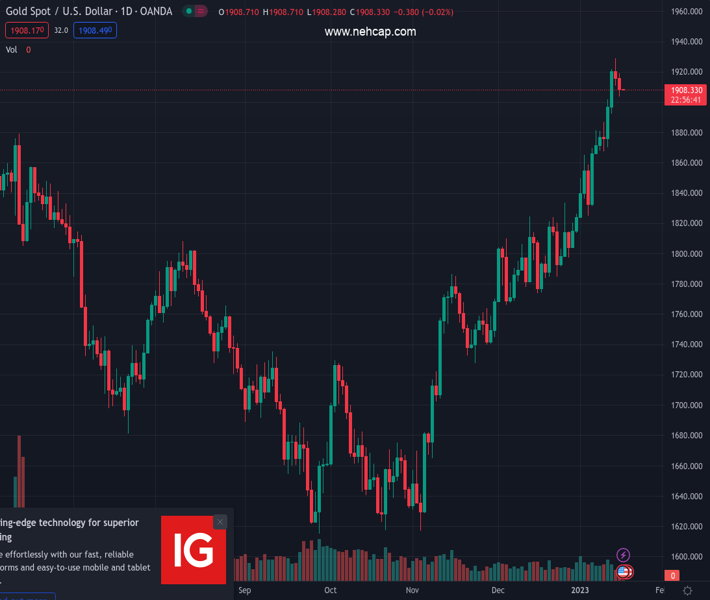
#XAUUSD @ 1,907.72 Gold price fades the week-start pullback from multi-month high but fails to recover., @nehcap view: Further weakness expected (Pivot Orderbook analysis)
…
This is a premium post.
[s2If !current_user_can(access_s2member_level4)]Please register for PREMIUM VERSION HERE to read full post below containing analysis. In case of any error or you think you are not able to read the full post below, please email us at support#nehcap.com [lwa][/s2If] [s2If current_user_can(access_s2member_level4)]
- Gold price fades the week-start pullback from multi-month high but fails to recover.
- Softer data from United States failed to recall XAU/USD buyers as US Dollar benefits from firmer yields, downbeat Euro.
- US Retail Sales will be the key data, risk catalysts are important too.
The pair currently trades last at 1907.72.
The previous day high was 1929.02 while the previous day low was 1910.91. The daily 38.2% Fib levels comes at 1917.83, expected to provide resistance. Similarly, the daily 61.8% fib level is at 1922.1, expected to provide resistance.
Gold price (XAU/USD) remains lackluster as buyers struggle to defend the $1,900 threshold after declining during the first two days of the week. The yellow metal’s defensive performance could be linked to the recent increase in the United States Treasury bond yields and US Dollar despite softer US data. The reason could be linked to the downbeat Euro (EUR), as well as the cautious mood ahead of the key data, not to forget China’s inability to impress XAU/USD bulls despite firmer statistics.
After a drop to refresh the monthly low on Friday, the United States Treasury bond yields bottomed out in the last three days and underpinned the US Dollar’s gradual rebound from the lowest levels since early June. That said, the benchmark 10-year US Treasury bond yields ended the day with nearly four basis points (bps) of an upside to 3.55% even as the two-year counterpart retreated to 4.20%.
While the US Treasury bond yields allowed the US Dollar to remain firmer, downbeat prints of the New York manufacturing data, namely the Empire State Manufacturing Index for December, probed the US Dollar bulls and put a floor under the Gold price. That said, the NY Fed’s business gauge dropped sharply in January to -32.9 versus -4.5 market forecasts and -11.2 prior readings.
The data also helped the Federal Reserve Bank of Richmond’s President and CEO Thomas Barkin to state, “My hope is that we have passed the peak of inflation.” As a result, the US Dollar bulls had a tough ride and so do the Gold bears.
With the swirling talks of the European Central Bank’s (ECB) slower rate hike starting after February, the bloc’s currency Euro (EUR) had to trim some of the latest gains, which in turn allowed the US Dollar to remain firmer and weigh on the Gold price.
The dovish concerns surrounding the ECB’s next move could be linked to Bloomberg’s news saying, “ECB policymakers are starting to consider a slower pace of interest-rate hikes after a likely 50 basis-point step in February.”
In doing so, the EUR couldn’t cheer upbeat sentiment data from the Zentrum für Europäische Wirtschaftsforschung (ZEW) for Germany and Eurozone. That said, German ZEW headline numbers showed that the Economic Sentiment Index returned to positive territory, arriving at 16.9 in January from -23.3 in December, beating the market expectation of -15.5. On the other hand, the ZEW Economic Sentiment Index for the Eurozone rose to 16.7 from -23.6.
China’s inability to impress markets despite posting upbeat data gains the major attention of the Gold sellers. On Tuesday, China’s National Bureau of Statistics (NBS) released the fourth quarter (Q4) Gross Domestic Product (GDP), as well as Industrial Production and Retail Sales figures for December. However, downbeat comments from NBS joined the market’s doubts about the actual numbers seemed to have weighed on the risk profile.
China’s Q4 GDP rose 2.9% YoY versus the 1.8% expected and 3.9% prior. Further details suggest that the Industrial Production for December grew 1.3% YoY versus 0.5% market forecasts and 2.2% prior readings. Additionally, Retail Sales improved to -1.8% YoY for December compared to -7.8% consensus and -5.9% prior. Even so, the NBS said that the foundation for economic recovery is not solid yet.
Given China’s condition as one of the world’s biggest Gold consumers, the pessimism surrounding Beijing could easily weigh on the XAU/USD prices.
Having witnessed mixed signals from the recently mixed consumer-centric data from the United States, coupled with the Federal Reserve (Fed) policymakers’ inability to defend the hawkish bias, today’s US Retail Sales and the Producer Price Index (PPI) for December will be crucial for the Gold traders.
Forecasts suggest that the headlines US Retail Sales may improve with 0.1% monthly gains, versus the previous contraction of 0.6%, and can favor the XAU/USD bears. However, the anticipated softening in the PPI, to -0.1% from 0.3% prior, could help recall the Gold buyers amid easing inflation fears.
Gold price grinds lower inside a three-day-old bearish channel amid sluggish signals from the Moving Average Convergence and Divergence (MACD) indicator, as well as the steady Relative Strength Index (RSI) line, placed at 14.
Given the 50-Hour Moving Average (HMA) adding strength to the immediate upside hurdle surrounding $1,915, the sluggish MACD and RSI positions hint at the further weakening of the XAU/USD.
However, the stated channel’s lower line, close to the $1,900 threshold, limits the short-term downside of the bullion, a break of which could drag the quote towards the 200-HMA level surrounding $1,883.
Meanwhile, an upside clearance of the $1,915 resistance confluence won’t hesitate to challenge the multi-month high marked on Monday at around $1,930.
Following that, tops marked during late March 2022 near $1,966 and April 2022 peak of $1,998 could probe the Gold buyers before offering them the $2,000 psychological magnet.
Trend: Further weakness expected
Technical Levels: Supports and Resistances
XAUUSD currently trading at 1908.66 at the time of writing. Pair opened at 1914.43 and is trading with a change of -0.30% % .
| Overview | Overview.1 | |
|---|---|---|
| 0 | Today last price | 1908.66 |
| 1 | Today Daily Change | -5.77 |
| 2 | Today Daily Change % | -0.30% |
| 3 | Today daily open | 1914.43 |
The pair remains strongly bullish on the daily timeframe. It trades above its 20 SMA @ 1842.58, 50 SMA 1797.84, 100 SMA @ 1735.86 and 200 SMA @ 1776.96.
| Trends | Trends.1 | |
|---|---|---|
| 0 | Daily SMA20 | 1842.58 |
| 1 | Daily SMA50 | 1797.84 |
| 2 | Daily SMA100 | 1735.86 |
| 3 | Daily SMA200 | 1776.96 |
The previous day high was 1929.02 while the previous day low was 1910.91. The daily 38.2% Fib levels comes at 1917.83, expected to provide resistance. Similarly, the daily 61.8% fib level is at 1922.1, expected to provide resistance.
Note the levels of interest below:
- Pivot support is noted at 1907.22, 1900.01, 1889.11
- Pivot resistance is noted at 1925.33, 1936.23, 1943.44
| Levels | Levels.1 |
|---|---|
| Previous Daily High | 1929.02 |
| Previous Daily Low | 1910.91 |
| Previous Weekly High | 1921.96 |
| Previous Weekly Low | 1865.22 |
| Previous Monthly High | 1833.38 |
| Previous Monthly Low | 1765.89 |
| Daily Fibonacci 38.2% | 1917.83 |
| Daily Fibonacci 61.8% | 1922.10 |
| Daily Pivot Point S1 | 1907.22 |
| Daily Pivot Point S2 | 1900.01 |
| Daily Pivot Point S3 | 1889.11 |
| Daily Pivot Point R1 | 1925.33 |
| Daily Pivot Point R2 | 1936.23 |
| Daily Pivot Point R3 | 1943.44 |
[/s2If]
Join Our Telegram Group
")


