Upbeat China’s data and the removal of strict Covid-19 measures to boost oil demand. (Pivot Orderbook analysis)
…
This is a premium post.
[s2If !current_user_can(access_s2member_level4)]Please register for PREMIUM VERSION HERE to read full post below containing analysis. In case of any error or you think you are not able to read the full post below, please email us at support#nehcap.com [lwa][/s2If] [s2If current_user_can(access_s2member_level4)]
- Upbeat China’s data and the removal of strict Covid-19 measures to boost oil demand.
- A softer US Dollar was a tailwind for WTI.
- WTI Price Analysis: It could aim towards the 100-DMA around $83.00.
The pair currently trades last at 81.25.
The previous day high was 80.44 while the previous day low was 78.78. The daily 38.2% Fib levels comes at 79.42, expected to provide support. Similarly, the daily 61.8% fib level is at 79.81, expected to provide support.
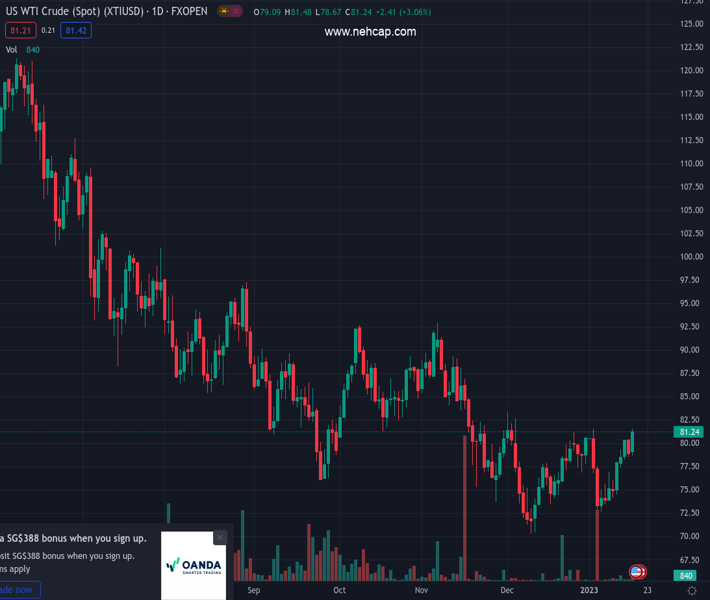
US Western Texas Intermediate (WTI) crude oil gains some ground and hits a two-week high above $80.00 per barrel on Tuesday after Chinese data beat estimates and painted an optimistic outlook amidst its borders reopening. Therefore, WTI is trading at $81.11 PB, up by more than 2.50%.
Chinese data revealed during the Asian session improved oil’s outlook for 2023. The National Bureau of Statistics showed that Gross Domestic Product (GDP) for Q4 improved to 2.9%, above estimates of 1.6%, while for the full year, GDP stood at 3% and trailed 2021 at 8.1%. Even though 2022 is the second worst reading since 1970, China’s relaxation of Covid-19 measures would positively impact its domestic economy.
In the meantime, a softer US Dollar makes greenback-denominated oil cheaper for other currency holders.
Elsewhere, the Organization of the Petroleum Exporting Countries (OPEC) said in a monthly report that Chinese oil demand would grow 510,000 barrels per day this year while it kept its 2023 global demand growth forecast unchanged at 2.22 million BPD.
After bottoming around 2022 lows of $70.10 PB during December, WTI resumed an uptrend of almost one month that peaked at around $81.44. Last Friday, WTI broke a two-month-old downslope trendline on the upside, which kept WTI prices from falling below $78.00. Additionally, the Relative Strength Index (RSI) aimed higher, while the Rate of Change (RoC) suggests buyers are gathering momentum.
Therefore, WTI’s first resistance level would be $81.00, which, once cleared, would expose $82.00, followed by the 100-day EMA at $82.95.
Technical Levels: Supports and Resistances
XTIUSD currently trading at 81.25 at the time of writing. Pair opened at 79.12 and is trading with a change of 2.69 % .
| Overview | Overview.1 | |
|---|---|---|
| 0 | Today last price | 81.25 |
| 1 | Today Daily Change | 2.13 |
| 2 | Today Daily Change % | 2.69 |
| 3 | Today daily open | 79.12 |
The pair is trading above its 20 Daily moving average @ 77.71, above its 50 Daily moving average @ 78.6 , below its 100 Daily moving average @ 82.13 and below its 200 Daily moving average @ 92.38
| Trends | Trends.1 | |
|---|---|---|
| 0 | Daily SMA20 | 77.71 |
| 1 | Daily SMA50 | 78.60 |
| 2 | Daily SMA100 | 82.13 |
| 3 | Daily SMA200 | 92.38 |
The previous day high was 80.44 while the previous day low was 78.78. The daily 38.2% Fib levels comes at 79.42, expected to provide support. Similarly, the daily 61.8% fib level is at 79.81, expected to provide support.
Note the levels of interest below:
- Pivot support is noted at 78.46, 77.8, 76.81
- Pivot resistance is noted at 80.11, 81.1, 81.76
| Levels | Levels.1 |
|---|---|
| Previous Daily High | 80.44 |
| Previous Daily Low | 78.78 |
| Previous Weekly High | 80.25 |
| Previous Weekly Low | 73.89 |
| Previous Monthly High | 83.30 |
| Previous Monthly Low | 70.27 |
| Daily Fibonacci 38.2% | 79.42 |
| Daily Fibonacci 61.8% | 79.81 |
| Daily Pivot Point S1 | 78.46 |
| Daily Pivot Point S2 | 77.80 |
| Daily Pivot Point S3 | 76.81 |
| Daily Pivot Point R1 | 80.11 |
| Daily Pivot Point R2 | 81.10 |
| Daily Pivot Point R3 | 81.76 |
[/s2If]
Join Our Telegram Group
")


