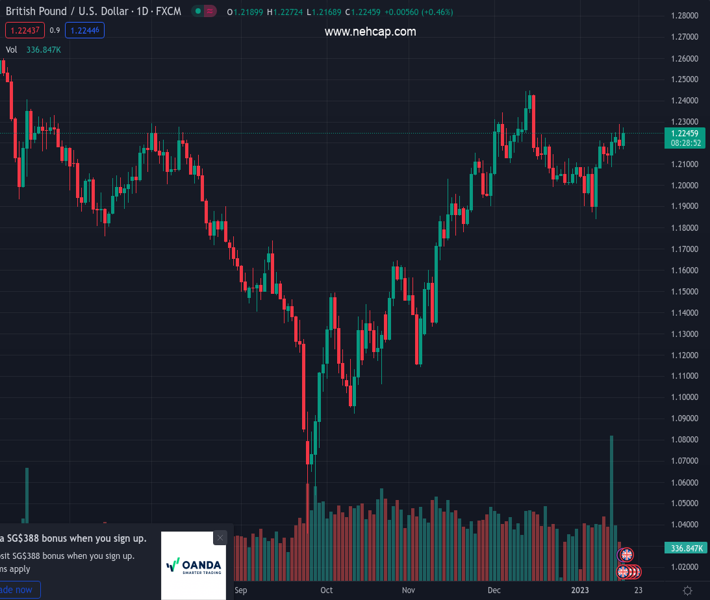
#GBPUSD @ 1.22416 regains positive traction on Tuesday following the release of the UK jobs report. (Pivot Orderbook analysis)
…
This is a premium post.
[s2If !current_user_can(access_s2member_level4)]Please register for PREMIUM VERSION HERE to read full post below containing analysis. In case of any error or you think you are not able to read the full post below, please email us at support#nehcap.com [lwa][/s2If] [s2If current_user_can(access_s2member_level4)]
- GBP/USD regains positive traction on Tuesday following the release of the UK jobs report.
- Stronger wage growth data might force the BoE to hike further and boosts the British Pound.
- A combination of factors continues to underpin the USD and keeps a lid on any further gains.
The pair currently trades last at 1.22416.
The previous day high was 1.2289 while the previous day low was 1.2172. The daily 38.2% Fib levels comes at 1.2216, expected to provide support. Similarly, the daily 61.8% fib level is at 1.2244, expected to provide resistance.
The GBP/USD pair attracts fresh buying near the 1.2170-1.2165 region on Tuesday and steadily climbs back closer to a one-month high touched the previous day. The pair, however, trims a part of its intraday gains and retreats below mid-1.2200s during the early North American session.
The British Pound strengthens a bit following the release of the UK monthly employment details, which, in turn, is seen pushing the GBP/USD pair higher. The UK Office for National Statistics (ONS) reported that Average Earnings, both including and excluding bonuses, climbed 6.4% in the September-to-November period. Furthermore, the number of people claiming unemployment-related benefits fell to 19.7K in December from 30.5K previous and the jobless rate held steady at 3.7%, close to its lowest level in almost 50 years. This could add pressure on the Bank of England to raise interest rates by another 50 bps at the next policy meeting and provides a modest lift to the domestic currency.
The US Dollar, on the other hand, struggles to preserve its modest intraday gains and offers additional support to the GBP/USD pair. That said, a combination of factors continues to act as a tailwind for the greenback and keeps a lid on any further gains for the major, at least for the time being. A goodish intraday pickup in the US Treasury bond yields, along with a generally weaker tone around the equity markets, should limit the downside for the safe-haven buck. This, in turn, makes it prudent to wait for strong follow-through buying beyond the 1.2300 mark before traders start positioning for an extension of the pair’s recent appreciating move witnessed over the past one-and-half-week or so.
Next on tap is the release of the Empire State Manufacturing Index, which, along with the US bond yields and the broader risk sentiment, might influence the USD and provide some impetus to the GBP/USD pair. The focus will then shift to the latest UK consumer inflation figures due on Wednesday. Apart from this, the US Producer Price Index and monthly Retail Sales figures will be looked upon to determine the near-term trajectory for the GBP/USD pair.
Technical Levels: Supports and Resistances
GBPUSD currently trading at 1.2239 at the time of writing. Pair opened at 1.2195 and is trading with a change of 0.36 % .
| Overview | Overview.1 | |
|---|---|---|
| 0 | Today last price | 1.2239 |
| 1 | Today Daily Change | 0.0044 |
| 2 | Today Daily Change % | 0.3600 |
| 3 | Today daily open | 1.2195 |
The pair remains strongly bullish on the daily timeframe. It trades above its 20 SMA @ 1.209, 50 SMA 1.2051, 100 SMA @ 1.1693 and 200 SMA @ 1.1993.
| Trends | Trends.1 | |
|---|---|---|
| 0 | Daily SMA20 | 1.2090 |
| 1 | Daily SMA50 | 1.2051 |
| 2 | Daily SMA100 | 1.1693 |
| 3 | Daily SMA200 | 1.1993 |
The previous day high was 1.2289 while the previous day low was 1.2172. The daily 38.2% Fib levels comes at 1.2216, expected to provide support. Similarly, the daily 61.8% fib level is at 1.2244, expected to provide resistance.
Note the levels of interest below:
- Pivot support is noted at 1.2148, 1.2101, 1.203
- Pivot resistance is noted at 1.2266, 1.2337, 1.2384
| Levels | Levels.1 |
|---|---|
| Previous Daily High | 1.2289 |
| Previous Daily Low | 1.2172 |
| Previous Weekly High | 1.2249 |
| Previous Weekly Low | 1.2086 |
| Previous Monthly High | 1.2447 |
| Previous Monthly Low | 1.1992 |
| Daily Fibonacci 38.2% | 1.2216 |
| Daily Fibonacci 61.8% | 1.2244 |
| Daily Pivot Point S1 | 1.2148 |
| Daily Pivot Point S2 | 1.2101 |
| Daily Pivot Point S3 | 1.2030 |
| Daily Pivot Point R1 | 1.2266 |
| Daily Pivot Point R2 | 1.2337 |
| Daily Pivot Point R3 | 1.2384 |
[/s2If]
Join Our Telegram Group
")


