#AUDUSD @ 0.69511 drifts into negative territory for the second straight day amid firmer USD. (Pivot Orderbook analysis)
…
This is a premium post.
[s2If !current_user_can(access_s2member_level4)]Please register for PREMIUM VERSION HERE to read full post below containing analysis. In case of any error or you think you are not able to read the full post below, please email us at support#nehcap.com [lwa][/s2If] [s2If current_user_can(access_s2member_level4)]
- AUD/USD drifts into negative territory for the second straight day amid firmer USD.
- Rebounding US bond yields and a softer risk tone benefits the safe-haven Greenback.
- Bets for smaller Fed rate hikes could act as a headwind for the buck and limit losses.
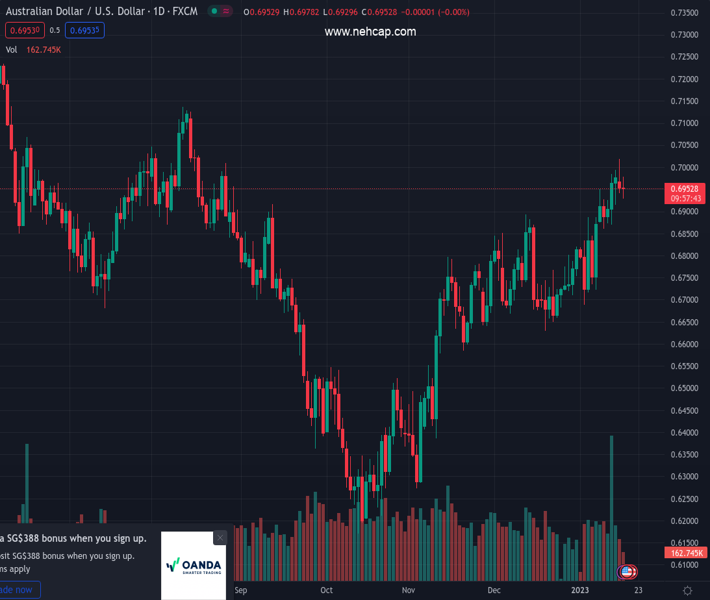
The pair currently trades last at 0.69511.
The previous day high was 0.7019 while the previous day low was 0.6941. The daily 38.2% Fib levels comes at 0.6971, expected to provide resistance. Similarly, the daily 61.8% fib level is at 0.6989, expected to provide resistance.
The AUD/USD pair attracts fresh selling following an early uptick to the 0.6975-0.6980 area and turns lower for the second successive day on Tuesday. Spot prices retreat further from the highest level since August 17 touched on Monday and drop to the 0.6930 region during the mid-European session.
A combination of factors assists the US Dollar to build on the previous day’s recovery from a seven-month low, which, in turn, is exerting some downward pressure on the AUD/USD pair. A goodish intraday pickup in the US Treasury bond yields underpins the Greenback. Apart from this, the prevalent cautious mood benefits the safe-haven buck and weighs on the risk-sensitive Aussie.
Investors remain concerned about a deeper global economic downturn amid the worst yet COVID-19 outbreak in China and the protracted Russia-Ukraine war. The fears were fueled by Tuesday’s release of the Chinese GDP report, which showed that growth decelerated from the third quarter’s reading of 3.9% to 2.9% during the October-December period – marking one of the worst levels in nearly half a century.
This, to a larger extent, overshadows the improving trend in Chinese Retail Sales and Industrial Production data, though fails to boost investors’ confidence. That said, growing acceptance that the Fed will soften its hawkish stance amid signs of easing inflationary pressure might keep a lid on the US bond yields and the USD. This, in turn, should lend some support to the AUD/USD pair.
Furthermore, rising odds for an additional interest rate hike by the Reserve Bank of Australia (RBA) in February should help limit the downside for the AUD/USD pair, at least for the time being. This makes it prudent to wait for strong follow-through selling before confirming that spot prices have topped out in the near term and positioning for a deeper corrective pullback.
Market participants now look to the US economic docket, featuring the Empire State Manufacturing Index. This, along with the US bond yields and the broader risk sentiment, will influence the USD price dynamics and provide some impetus to the AUD/USD pair. The focus will then shift to the US Producer Price Index and Retail Sales data, due for release on Wednesday.
Technical Levels: Supports and Resistances
AUDUSD currently trading at 0.6937 at the time of writing. Pair opened at 0.695 and is trading with a change of -0.19 % .
| Overview | Overview.1 | |
|---|---|---|
| 0 | Today last price | 0.6937 |
| 1 | Today Daily Change | -0.0013 |
| 2 | Today Daily Change % | -0.1900 |
| 3 | Today daily open | 0.6950 |
The pair remains strongly bullish on the daily timeframe. It trades above its 20 SMA @ 0.6807, 50 SMA 0.6749, 100 SMA @ 0.6636 and 200 SMA @ 0.6829.
| Trends | Trends.1 | |
|---|---|---|
| 0 | Daily SMA20 | 0.6807 |
| 1 | Daily SMA50 | 0.6749 |
| 2 | Daily SMA100 | 0.6636 |
| 3 | Daily SMA200 | 0.6829 |
The previous day high was 0.7019 while the previous day low was 0.6941. The daily 38.2% Fib levels comes at 0.6971, expected to provide resistance. Similarly, the daily 61.8% fib level is at 0.6989, expected to provide resistance.
Note the levels of interest below:
- Pivot support is noted at 0.6921, 0.6892, 0.6843
- Pivot resistance is noted at 0.6999, 0.7048, 0.7077
| Levels | Levels.1 |
|---|---|
| Previous Daily High | 0.7019 |
| Previous Daily Low | 0.6941 |
| Previous Weekly High | 0.6994 |
| Previous Weekly Low | 0.6860 |
| Previous Monthly High | 0.6893 |
| Previous Monthly Low | 0.6629 |
| Daily Fibonacci 38.2% | 0.6971 |
| Daily Fibonacci 61.8% | 0.6989 |
| Daily Pivot Point S1 | 0.6921 |
| Daily Pivot Point S2 | 0.6892 |
| Daily Pivot Point S3 | 0.6843 |
| Daily Pivot Point R1 | 0.6999 |
| Daily Pivot Point R2 | 0.7048 |
| Daily Pivot Point R3 | 0.7077 |
[/s2If]
Join Our Telegram Group
")


