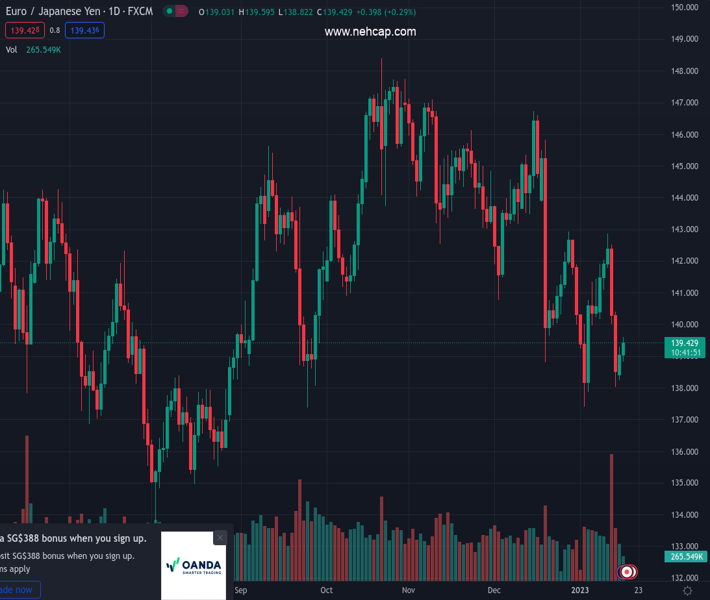
#EURJPY @ 139.435 adds to Monday’s gains north of the 139.00 hurdle. (Pivot Orderbook analysis)
…
This is a premium post.
[s2If !current_user_can(access_s2member_level4)]Please register for PREMIUM VERSION HERE to read full post below containing analysis. In case of any error or you think you are not able to read the full post below, please email us at support#nehcap.com [lwa][/s2If] [s2If current_user_can(access_s2member_level4)]
- EUR/JPY adds to Monday’s gains north of the 139.00 hurdle.
- Immediately to the upside now comes the 200-day SMA.
The pair currently trades last at 139.435.
The previous day high was 139.3 while the previous day low was 138.24. The daily 38.2% Fib levels comes at 138.89, expected to provide support. Similarly, the daily 61.8% fib level is at 138.64, expected to provide support.
EUR/JPY advances for the second session in a row and extends the breakout of the 138.00 yardstick on Tuesday.
Last week’s pronounced pullback appears to have met quite solid support in the 138.00 neighbourhood for the time being. The subsequent rebound looks healthy and initially targets the key 200-day SMA, today at 140.70.
The outlook for EUR/JPY should remain negative while below the 200-day SMA.
Technical Levels: Supports and Resistances
EURJPY currently trading at 139.47 at the time of writing. Pair opened at 139.09 and is trading with a change of 0.27 % .
| Overview | Overview.1 | |
|---|---|---|
| 0 | Today last price | 139.47 |
| 1 | Today Daily Change | 77.00 |
| 2 | Today Daily Change % | 0.27 |
| 3 | Today daily open | 139.09 |
The pair remains strongly bearish on the daily time frame. It trades below the 20 SMA @ 140.65, 50 SMA 142.91, 100 SMA @ 143.14 and 200 SMA @ 140.72.
| Trends | Trends.1 | |
|---|---|---|
| 0 | Daily SMA20 | 140.65 |
| 1 | Daily SMA50 | 142.91 |
| 2 | Daily SMA100 | 143.14 |
| 3 | Daily SMA200 | 140.72 |
The previous day high was 139.3 while the previous day low was 138.24. The daily 38.2% Fib levels comes at 138.89, expected to provide support. Similarly, the daily 61.8% fib level is at 138.64, expected to provide support.
Note the levels of interest below:
- Pivot support is noted at 138.45, 137.81, 137.39
- Pivot resistance is noted at 139.52, 139.94, 140.58
| Levels | Levels.1 |
|---|---|
| Previous Daily High | 139.30 |
| Previous Daily Low | 138.24 |
| Previous Weekly High | 142.86 |
| Previous Weekly Low | 138.01 |
| Previous Monthly High | 146.73 |
| Previous Monthly Low | 138.80 |
| Daily Fibonacci 38.2% | 138.89 |
| Daily Fibonacci 61.8% | 138.64 |
| Daily Pivot Point S1 | 138.45 |
| Daily Pivot Point S2 | 137.81 |
| Daily Pivot Point S3 | 137.39 |
| Daily Pivot Point R1 | 139.52 |
| Daily Pivot Point R2 | 139.94 |
| Daily Pivot Point R3 | 140.58 |
[/s2If]
Join Our Telegram Group
")


