#GBPUSD @ 1.21943 takes offers to refresh intraday low, extends week-start pullback from one-month high. (Pivot Orderbook analysis)
…
This is a premium post.
[s2If !current_user_can(access_s2member_level4)]Please register for PREMIUM VERSION HERE to read full post below containing analysis. In case of any error or you think you are not able to read the full post below, please email us at support#nehcap.com [lwa][/s2If] [s2If current_user_can(access_s2member_level4)]
- GBP/USD takes offers to refresh intraday low, extends week-start pullback from one-month high.
- UK Claimant Count Change eased to 19.7K in December, Unemployment Rate remains unchanged for three months to November.
- US Dollar’s failure to track rebound in yields propel Cable prices despite negatives surrounding labor strike, inflation fears.
- Second-tier US data, risk catalysts can entertain traders ahead of the key Wednesday.
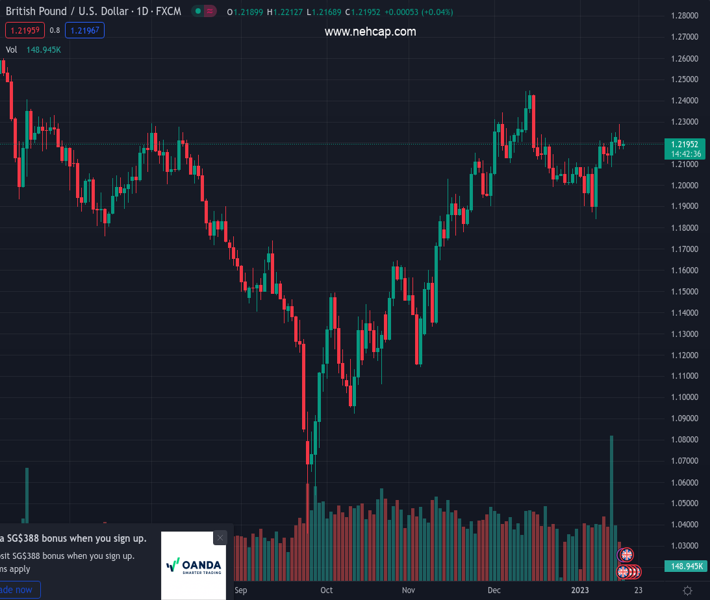
The pair currently trades last at 1.21943.
The previous day high was 1.2289 while the previous day low was 1.2172. The daily 38.2% Fib levels comes at 1.2216, expected to provide resistance. Similarly, the daily 61.8% fib level is at 1.2244, expected to provide resistance.
GBP/USD prints a two-day losing streak as it renews its intraday low after the UK’s employment data during early Tuesday. That said, the Cable pair slid to 1.2169 before recovering to 1.2190 by the press time.
The UK’s Office for National Statistics (ONS) released its monthly jobs report early Tuesday. Among the key data, the Claimant Count Change for December and the Unemployment Rate for three months to November gained major attention. That said, the Claimant Count Change came in as 19.7K versus 30.5K while the Unemployment Rate remained unchanged at 3.7%.
Also read: UK ILO Unemployment Rate steadies at 3.7% in November vs. 3.7% expected
Other than the mixed data, pessimism surrounding the UK’s labor strikes and downbeat testimony from Bank of England (BoE) Governor Andrew Bailey also weigh on the GBP/USD price. BoE’s Bailey testified against the Treasury Select Committee in London while stating that inflation looked set to fall markedly this year. BoE’s Bailey, however, cited growth fears emanating from workers’ strikes.
Elsewhere, the market’s skepticism about Chinese growth numbers joins the lack of major data/events, as well as fears of recession, to weigh on the risk profile. The same underpins the US Treasury yields’ rebound, as well as weighs on the S&P 500 Futures as it retreats from the one-month high. However, the US Dollar Index (DXY) fades the previous day’s bounce off the seven-month low.
“Two-thirds of private and public sector chief economists surveyed by the WEF expect a global recession this year, with some 18% considering it ‘extremely likely’ – more than twice as many as in the previous survey conducted in September 2022,” reported Reuters.
Looking ahead, NY Empire State Manufacturing Index for January, expected -4.5 versus -11.2 prior, may entertain intraday traders during the return of full markets. However, major attention will be given to Wednesday’s UK Consumer Price Index (CPI) and the US Retail Sales for December.
Also read: UK Inflation Preview: Another soft CPI to hit Pound Sterling, here’s why
Although the GBP/USD pair’s ability to stay beyond the 100-day EMA level surrounding 1.1940 keeps buyers hopeful, together with the bullish MACD signals and firmer RSI, the upside momentum remains elusive unless crossing a six-week-old horizontal resistance near 1.2345.
Technical Levels: Supports and Resistances
GBPUSD currently trading at 1.2172 at the time of writing. Pair opened at 1.2195 and is trading with a change of -0.19% % .
| Overview | Overview.1 | |
|---|---|---|
| 0 | Today last price | 1.2172 |
| 1 | Today Daily Change | -0.0023 |
| 2 | Today Daily Change % | -0.19% |
| 3 | Today daily open | 1.2195 |
The pair remains strongly bullish on the daily timeframe. It trades above its 20 SMA @ 1.209, 50 SMA 1.2051, 100 SMA @ 1.1693 and 200 SMA @ 1.1993.
| Trends | Trends.1 | |
|---|---|---|
| 0 | Daily SMA20 | 1.2090 |
| 1 | Daily SMA50 | 1.2051 |
| 2 | Daily SMA100 | 1.1693 |
| 3 | Daily SMA200 | 1.1993 |
The previous day high was 1.2289 while the previous day low was 1.2172. The daily 38.2% Fib levels comes at 1.2216, expected to provide resistance. Similarly, the daily 61.8% fib level is at 1.2244, expected to provide resistance.
Note the levels of interest below:
- Pivot support is noted at 1.2148, 1.2101, 1.203
- Pivot resistance is noted at 1.2266, 1.2337, 1.2384
| Levels | Levels.1 |
|---|---|
| Previous Daily High | 1.2289 |
| Previous Daily Low | 1.2172 |
| Previous Weekly High | 1.2249 |
| Previous Weekly Low | 1.2086 |
| Previous Monthly High | 1.2447 |
| Previous Monthly Low | 1.1992 |
| Daily Fibonacci 38.2% | 1.2216 |
| Daily Fibonacci 61.8% | 1.2244 |
| Daily Pivot Point S1 | 1.2148 |
| Daily Pivot Point S2 | 1.2101 |
| Daily Pivot Point S3 | 1.2030 |
| Daily Pivot Point R1 | 1.2266 |
| Daily Pivot Point R2 | 1.2337 |
| Daily Pivot Point R3 | 1.2384 |
[/s2If]
Join Our Telegram Group
")


