#USDCHF @ 0.92468 takes offers to reverse the week-start rebound. (Pivot Orderbook analysis)
…
This is a premium post.
[s2If !current_user_can(access_s2member_level4)]Please register for PREMIUM VERSION HERE to read full post below containing analysis. In case of any error or you think you are not able to read the full post below, please email us at support#nehcap.com [lwa][/s2If] [s2If current_user_can(access_s2member_level4)]
- USD/CHF takes offers to reverse the week-start rebound.
- DXY retreats despite firmer Treasury bond yields, sour sentiment as full markets return.
- Updates from Davos can entertain traders ahead of US Retail Sales.
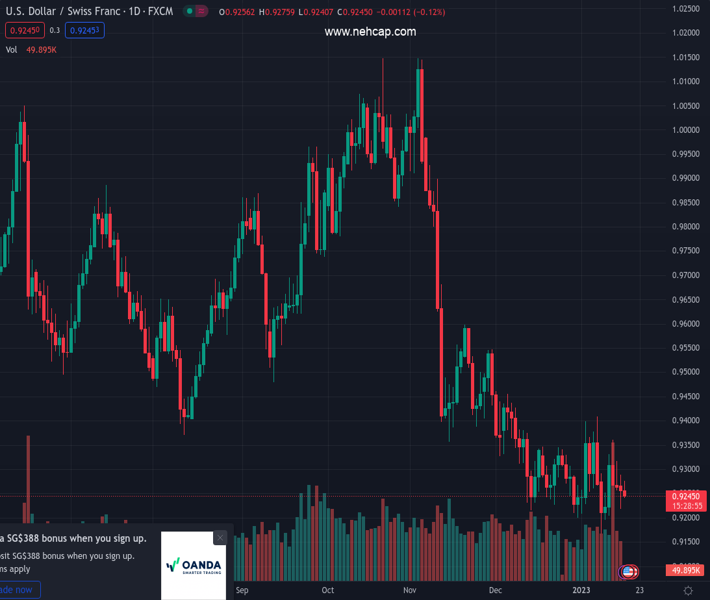
The pair currently trades last at 0.92468.
The previous day high was 0.9288 while the previous day low was 0.9219. The daily 38.2% Fib levels comes at 0.9262, expected to provide resistance. Similarly, the daily 61.8% fib level is at 0.9245, expected to provide support.
USD/CHF holds lower ground near the intraday bottom of 0.9243 as European traders brace for an active Tuesday, mainly due to the return of the US market players after a long weekend. Adding strength to the pair’s pullback moves could be the mixed sentiment in the market, which in turn probes the US dollar’s rebound from a multi-month low.
That said, the market’s skepticism about Chinese growth numbers joins the lack of major data/events, as well as fears of recession, to weigh on the risk profile. The same underpins the US Treasury yields’ rebound, as well as weighs on the S&P 500 Futures as it retreats from the one-month high.
“Two-thirds of private and public sector chief economists surveyed by the WEF expect a global recession this year, with some 18% considering it ‘extremely likely’ – more than twice as many as in the previous survey conducted in September 2022,” reported Reuters.
On the same line, China reported upbeat prints of the fourth quarter (Q4) Gross Domestic Product (GDP), as well as Industrial Production and Retail Sales for December. However, the National Bureau of Statistics (NBS) from Beijing mentioned that the foundation for economic recovery is not solid yet, which in turn weighed on the risk profile afterward.
Alternatively, receding fears of the Fed’s monetary policy contraction, especially after the recently mixed US data, allow traders to remain hopeful ahead of this week’s key data, namely US Retail Sales for December, expected 0.1% YoY versus -0.6% prior.
Ahead of that, NY Empire State Manufacturing Index for January, expected -4.5 versus -11.2 prior, may entertain traders while updates from Davos could offer additional hints to the USD/CHF pair traders.
Despite the latest weakness, the USD/CHF pair is yet to defy the previous day’s bullish signals, flashed via the Doji candlestick on the Daily formation, which in turn keeps the pair buyers hopeful of poking a one-week-old resistance line near 0.9320 by the press time. Alternatively, Monday’s low of 0.9218 puts a floor under short-term declines of the pair.
Technical Levels: Supports and Resistances
USDCHF currently trading at 0.9245 at the time of writing. Pair opened at 0.9263 and is trading with a change of -0.19% % .
| Overview | Overview.1 | |
|---|---|---|
| 0 | Today last price | 0.9245 |
| 1 | Today Daily Change | -0.0018 |
| 2 | Today Daily Change % | -0.19% |
| 3 | Today daily open | 0.9263 |
The pair remains strongly bearish on the daily time frame. It trades below the 20 SMA @ 0.9284, 50 SMA 0.9385, 100 SMA @ 0.962 and 200 SMA @ 0.9643.
| Trends | Trends.1 | |
|---|---|---|
| 0 | Daily SMA20 | 0.9284 |
| 1 | Daily SMA50 | 0.9385 |
| 2 | Daily SMA100 | 0.9620 |
| 3 | Daily SMA200 | 0.9643 |
The previous day high was 0.9288 while the previous day low was 0.9219. The daily 38.2% Fib levels comes at 0.9262, expected to provide resistance. Similarly, the daily 61.8% fib level is at 0.9245, expected to provide support.
Note the levels of interest below:
- Pivot support is noted at 0.9225, 0.9187, 0.9155
- Pivot resistance is noted at 0.9295, 0.9326, 0.9364
| Levels | Levels.1 |
|---|---|
| Previous Daily High | 0.9288 |
| Previous Daily Low | 0.9219 |
| Previous Weekly High | 0.9363 |
| Previous Weekly Low | 0.9167 |
| Previous Monthly High | 0.9471 |
| Previous Monthly Low | 0.9201 |
| Daily Fibonacci 38.2% | 0.9262 |
| Daily Fibonacci 61.8% | 0.9245 |
| Daily Pivot Point S1 | 0.9225 |
| Daily Pivot Point S2 | 0.9187 |
| Daily Pivot Point S3 | 0.9155 |
| Daily Pivot Point R1 | 0.9295 |
| Daily Pivot Point R2 | 0.9326 |
| Daily Pivot Point R3 | 0.9364 |
[/s2If]
Join Our Telegram Group
")


