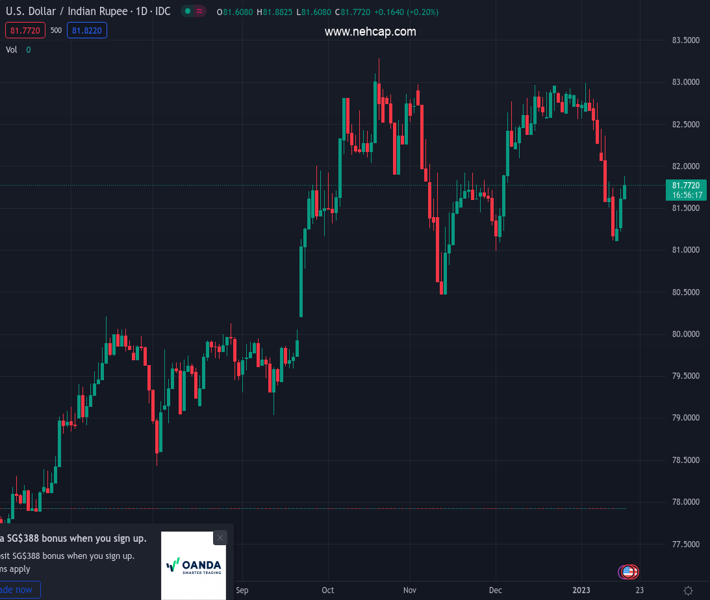
#USDINR @ 81.7800 picks up bids to portray three-day winning streak, extends bounce off monthly low. (Pivot Orderbook analysis)
…
This is a premium post.
[s2If !current_user_can(access_s2member_level4)]Please register for PREMIUM VERSION HERE to read full post below containing analysis. In case of any error or you think you are not able to read the full post below, please email us at support#nehcap.com [lwa][/s2If] [s2If current_user_can(access_s2member_level4)]
- USD/INR picks up bids to portray three-day winning streak, extends bounce off monthly low.
- China’s upbeat data-dump fails to trigger risk-on mood as full markets return.
- US Dollar Index traces yields to pare recent losses around multi-month low.
- Risk catalysts are the key ahead of US Retail Sales for December.
The pair currently trades last at 81.7800.
The previous day high was 81.7414 while the previous day low was 81.1625. The daily 38.2% Fib levels comes at 81.5203, expected to provide support. Similarly, the daily 61.8% fib level is at 81.3837, expected to provide support.
USD/INR remains on the front foot for the third consecutive day as the pair buyers approach 82.00, up 0.20% around 81.80 by the press time, during the initial trading hours of the Indian market opening on Tuesday.
The Indian rupee (INR) pair’s latest rebound could be linked to the market’s inability to extend the previous risk-on mood as the US traders return to the desk after a long weekend.
While tracing the link to sentiment, China’s ability to impress markets despite posting upbeat data gains major attention. Earlier in the day, China’s National Bureau of Statistics (NBS) released the fourth quarter (Q4) Gross Domestic Product (GDP), as well as Industrial Production and Retail Sales figures for December. However, downbeat comments from NBS joined the market’s doubts about the actual numbers seemed to have weighed on the risk profile.
That said, China’s Q4 GDP rose 2.9% YoY versus 1.8% expected and 3.9% prior. Further details suggest that the Industrial Production for December grew 1.3% YoY versus 0.5% market forecasts and 2.2% prior readings. Additionally, Retail Sales improved to -1.8% YoY for December compared to -7.8% consensus and -5.9% prior. Even so, the NBS said that the foundation for economic recovery is not solid yet.
Elsewhere, the US 10-year Treasury yields defend the week-start recovery, up two basis points (bps) near 3.54% while S&P 500 Futures print mild losses as it retreats from the monthly high. It’s worth noting that shares in India remain mildly bid but those from China and Australia print losses and challenge the risk appetite.
As a result, the US Dollar Index (DXY) extends the previous day’s rebound from the lowest levels since June 2022.
Not only had the shift in the risk appetite but an improvement in the Oil prices and doubts over the Reserve Bank of India’s (RBI) capacity to defend the INR, considering the reliance on imports and wide budget deficit, also seem to propel the USD/INR prices of late. That said, WTI crude oil picks up bids to reverse the week-start pullback from a two-week high, up 0.60% intraday near $79.60 at the latest.
Looking forward, the second-tier US data like NY Empire State Manufacturing Index for January, expected -4.5 versus -11.2 prior, for clear directions. However, major attention will be given to Wednesday’s US Retail Sales for December, expected 0.1% YoY versus -0.6% prior. Above all, February 01 will the key day for the USD/INR pair traders as it will offer the budget proposal from Indian Finance Minister and the Federal Reserve (Fed) also holds its monetary policy meeting on that day.
A fortnight-old descending resistance line challenges USD/INR bulls around 81.90.
Technical Levels: Supports and Resistances
USDINR currently trading at 81.7765 at the time of writing. Pair opened at 81.6525 and is trading with a change of 0.15% % .
| Overview | Overview.1 | |
|---|---|---|
| 0 | Today last price | 81.7765 |
| 1 | Today Daily Change | 0.1240 |
| 2 | Today Daily Change % | 0.15% |
| 3 | Today daily open | 81.6525 |
The pair is trading below its 20 Daily moving average @ 82.3796, below its 50 Daily moving average @ 82.0104 , above its 100 Daily moving average @ 81.6666 and above its 200 Daily moving average @ 79.9771
| Trends | Trends.1 | |
|---|---|---|
| 0 | Daily SMA20 | 82.3796 |
| 1 | Daily SMA50 | 82.0104 |
| 2 | Daily SMA100 | 81.6666 |
| 3 | Daily SMA200 | 79.9771 |
The previous day high was 81.7414 while the previous day low was 81.1625. The daily 38.2% Fib levels comes at 81.5203, expected to provide support. Similarly, the daily 61.8% fib level is at 81.3837, expected to provide support.
Note the levels of interest below:
- Pivot support is noted at 81.2962, 80.9399, 80.7172
- Pivot resistance is noted at 81.8751, 82.0978, 82.4541
| Levels | Levels.1 |
|---|---|
| Previous Daily High | 81.7414 |
| Previous Daily Low | 81.1625 |
| Previous Weekly High | 82.5294 |
| Previous Weekly Low | 81.0769 |
| Previous Monthly High | 84.2500 |
| Previous Monthly Low | 80.9855 |
| Daily Fibonacci 38.2% | 81.5203 |
| Daily Fibonacci 61.8% | 81.3837 |
| Daily Pivot Point S1 | 81.2962 |
| Daily Pivot Point S2 | 80.9399 |
| Daily Pivot Point S3 | 80.7172 |
| Daily Pivot Point R1 | 81.8751 |
| Daily Pivot Point R2 | 82.0978 |
| Daily Pivot Point R3 | 82.4541 |
[/s2If]
Join Our Telegram Group
")


