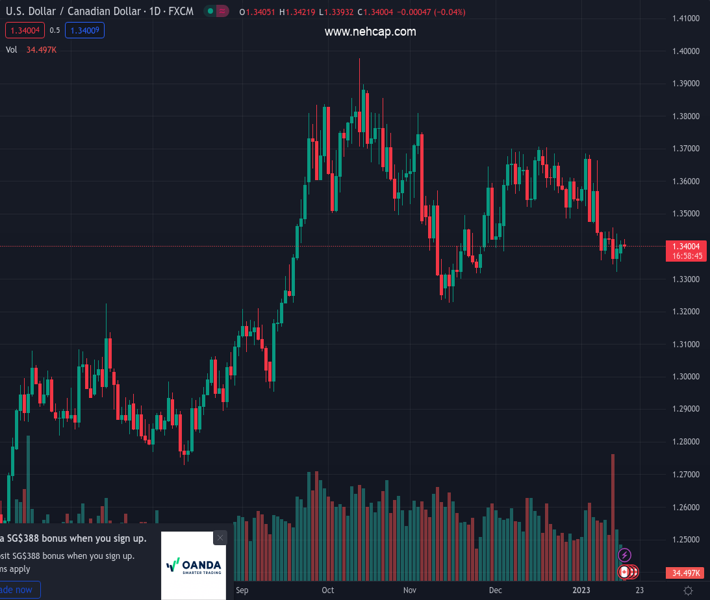
#USDCAD @ 1.33987 oscillates in a narrow band and is influenced by a combination of diverging forces. (Pivot Orderbook analysis)
…
This is a premium post.
[s2If !current_user_can(access_s2member_level4)]Please register for PREMIUM VERSION HERE to read full post below containing analysis. In case of any error or you think you are not able to read the full post below, please email us at support#nehcap.com [lwa][/s2If] [s2If current_user_can(access_s2member_level4)]
- USD/CAD oscillates in a narrow band and is influenced by a combination of diverging forces.
- A modest uptick in crude oil prices underpins the Loonie and acts as a headwind for the pair.
- A softer risk tone benefits the safe-haven greenback and helps limit any meaningful downside.
- Traders now look to Canadian consumer inflation and the US macro data for a fresh impetus.
The pair currently trades last at 1.33987.
The previous day high was 1.3418 while the previous day low was 1.3353. The daily 38.2% Fib levels comes at 1.3393, expected to provide support. Similarly, the daily 61.8% fib level is at 1.3378, expected to provide support.
The USD/CAD pair is struggling to gain any meaningful traction on Tuesday and oscillating in a narrow trading band through the Asian session. The pair is currently hovering around the 1.3400 mark, nearly unchanged for the day, and is influenced by a combination of diverging forces.
A modest uptick in crude oil prices underpins the commodity-linked Loonie and acts as a headwind for the USD/CAD pair. The negative factor, to a larger extent, is offset by some follow-through US Dollar buying, which, in turn, lends some support to the major and helps limit the downside, at least for the time being.
Data released earlier this Tuesday showed that China’s economy grew at a better-than-expected pace in the fourth quarter. Furthermore, improving trends in Chinese Retail Sales and Industrial Production fueled optimism over an economic recovery in the world’s largest crude importer and acts as a tailwind for oil prices.
That said, worries about a potential global recession keep a lid on any meaningful upside for the black liquid. Traders also seem reluctant and prefer to wait on the sidelines ahead of the monthly OPEC report, due later this Tuesday, which will be looked upon for any change in the demand forecast for the current year.
The US Dollar, on the other hand, attracts some haven flows amid the prevalent cautious market mood, though lacks bullish conviction amid hopes for a less aggressive policy tightening by the Fed. The mixed fundamental backdrop warrants some caution before positioning for a firm intraday direction for the USD/CAD pair.
Moving ahead, the focus shifts to Canadian consumer inflation figures, due for release later during the early North American session. This, along with oil price dynamics, might influence the Canadian Dollar. Apart from this, the Empire State Manufacturing Index from the US should provide some impetus to the USD/CAD pair.
Technical Levels: Supports and Resistances
USDCAD currently trading at 1.34 at the time of writing. Pair opened at 1.3415 and is trading with a change of -0.11 % .
| Overview | Overview.1 | |
|---|---|---|
| 0 | Today last price | 1.3400 |
| 1 | Today Daily Change | -0.0015 |
| 2 | Today Daily Change % | -0.1100 |
| 3 | Today daily open | 1.3415 |
The pair is trading below its 20 Daily moving average @ 1.3521, below its 50 Daily moving average @ 1.3496 , below its 100 Daily moving average @ 1.35 and above its 200 Daily moving average @ 1.3173
| Trends | Trends.1 | |
|---|---|---|
| 0 | Daily SMA20 | 1.3521 |
| 1 | Daily SMA50 | 1.3496 |
| 2 | Daily SMA100 | 1.3500 |
| 3 | Daily SMA200 | 1.3173 |
The previous day high was 1.3418 while the previous day low was 1.3353. The daily 38.2% Fib levels comes at 1.3393, expected to provide support. Similarly, the daily 61.8% fib level is at 1.3378, expected to provide support.
Note the levels of interest below:
- Pivot support is noted at 1.3373, 1.333, 1.3308
- Pivot resistance is noted at 1.3438, 1.3461, 1.3503
| Levels | Levels.1 |
|---|---|
| Previous Daily High | 1.3418 |
| Previous Daily Low | 1.3353 |
| Previous Weekly High | 1.3461 |
| Previous Weekly Low | 1.3322 |
| Previous Monthly High | 1.3705 |
| Previous Monthly Low | 1.3385 |
| Daily Fibonacci 38.2% | 1.3393 |
| Daily Fibonacci 61.8% | 1.3378 |
| Daily Pivot Point S1 | 1.3373 |
| Daily Pivot Point S2 | 1.3330 |
| Daily Pivot Point S3 | 1.3308 |
| Daily Pivot Point R1 | 1.3438 |
| Daily Pivot Point R2 | 1.3461 |
| Daily Pivot Point R3 | 1.3503 |
[/s2If]
Join Our Telegram Group
")


