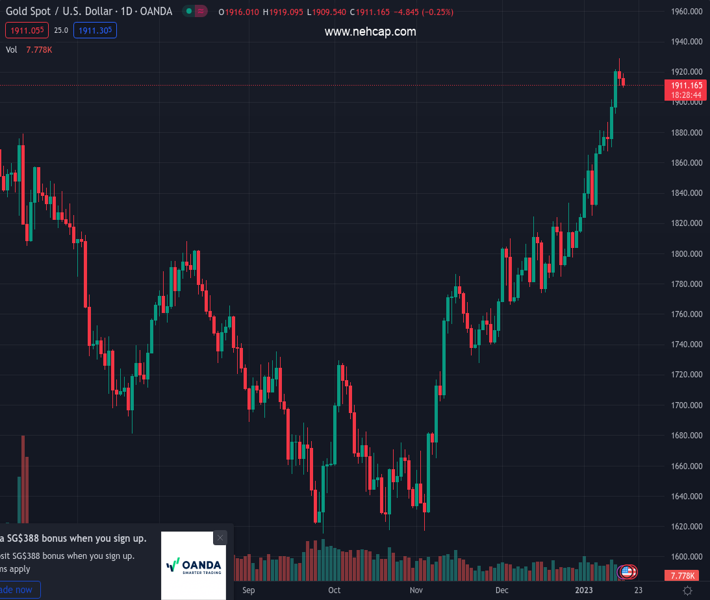
#XAUUSD @ 1,910.92 Gold price extends the week-start pullback from multi-month high., @nehcap view: Further downside expected (Pivot Orderbook analysis)
…
This is a premium post.
[s2If !current_user_can(access_s2member_level4)]Please register for PREMIUM VERSION HERE to read full post below containing analysis. In case of any error or you think you are not able to read the full post below, please email us at support#nehcap.com [lwa][/s2If] [s2If current_user_can(access_s2member_level4)]
- Gold price extends the week-start pullback from multi-month high.
- China reports upbeat GDP, Industrial Production and Retail Sales but NBS comments challenge optimism.
- Return of full markets underpins US Treasury yields rebound and challenge XAU/USD bulls.
The pair currently trades last at 1910.92.
The previous day high was 1929.02 while the previous day low was 1910.91. The daily 38.2% Fib levels comes at 1917.83, expected to provide resistance. Similarly, the daily 61.8% fib level is at 1922.1, expected to provide resistance.
Gold price (XAU/USD) drops for the second consecutive day after poking the highest levels since April 2022, down 0.20% intraday as sellers keep the reins near $1,910 during early Tuesday.
US Dollar Index rebound from the seven-month low, amid firmer US Treasury bond yields, underpinned the Gold price pullback on Monday. However, the price-negative market sentiment even after China’s upbeat economics seemed to have weighed on the XAU/USD of late.
Talking about the data, China’s Gross Domestic Product (GDP) for the fourth quarter (Q4) printed 0.0% QoQ figure versus -0.8% expected and 3.9% prior. Further details suggest that the Industrial Production for December grew 1.3% YoY versus 0.5% market forecasts and 2.2% prior readings. Additionally, Retail Sales improved to -1.8% YoY for December compared to -7.8% consensus and -5.9% prior.
It should be observed, however, that the China National Bureau of Statistics (NBS) mentioned after the data that the foundation for economic recovery is not solid yet.
Also read: China’s NBS: Foundation for economic recovery not solid yet
Other than the NBS comments, the market’s lack of acceptance of the upbeat China data, amid hopes of witnessing a downbeat outcome due to the COVID-19 woes, also seemed to have weighed on the sentiment and the XAU/USD prices. Furthermore, recently positive US sentiment figures and the inflation expectations conveyed on Friday, probed the previously dovish bias for the Federal Reserve (Fed) and hence underpin a rebound in the US Treasury bond yields.
That said, the S&P 500 Futures print mild losses as it retreats from the monthly high while the US 10-year Treasury yields defend the week-start recovery, up two basis points (bps) near 3.54% by the press time.
Moving on, Gold traders should wait for the second-tier US data like NY Empire State Manufacturing Index for January, expected -4.5 versus -11.2 prior, for clear directions. However, major attention will be given to Wednesday’s US Retail Sales for December, expected 0.1% YoY versus -0.6% prior.
A clear downside break of the three-day-old bullish channel favors Gold sellers as they approach the previous resistance line from January 09, close to $1,898 by the press time.
That said, the bearish MACD signals and downbeat RSI (14), not oversold, also keep the Gold bears hopeful.
It’s worth noting that the $1,900 threshold can act as immediate downside support while the 200-HMA level surrounding $1,878 could probe the XAU/USD bears afterward.
Alternatively, the stated channel’s lower line, close to $1,923 at the latest, restricts the immediate upside of the XAU/USD.
Following that, an ascending trend line from the last Thursday, near $1,947, could challenge the Gold buyers before directing them toward the April 2022 peak surrounding $1,998.
Trend: Further downside expected
Technical Levels: Supports and Resistances
XAUUSD currently trading at 1910.32 at the time of writing. Pair opened at 1914.43 and is trading with a change of -0.21% % .
| Overview | Overview.1 | |
|---|---|---|
| 0 | Today last price | 1910.32 |
| 1 | Today Daily Change | -4.11 |
| 2 | Today Daily Change % | -0.21% |
| 3 | Today daily open | 1914.43 |
The pair remains strongly bullish on the daily timeframe. It trades above its 20 SMA @ 1842.58, 50 SMA 1797.84, 100 SMA @ 1735.86 and 200 SMA @ 1776.96.
| Trends | Trends.1 | |
|---|---|---|
| 0 | Daily SMA20 | 1842.58 |
| 1 | Daily SMA50 | 1797.84 |
| 2 | Daily SMA100 | 1735.86 |
| 3 | Daily SMA200 | 1776.96 |
The previous day high was 1929.02 while the previous day low was 1910.91. The daily 38.2% Fib levels comes at 1917.83, expected to provide resistance. Similarly, the daily 61.8% fib level is at 1922.1, expected to provide resistance.
Note the levels of interest below:
- Pivot support is noted at 1907.22, 1900.01, 1889.11
- Pivot resistance is noted at 1925.33, 1936.23, 1943.44
| Levels | Levels.1 |
|---|---|
| Previous Daily High | 1929.02 |
| Previous Daily Low | 1910.91 |
| Previous Weekly High | 1921.96 |
| Previous Weekly Low | 1865.22 |
| Previous Monthly High | 1833.38 |
| Previous Monthly Low | 1765.89 |
| Daily Fibonacci 38.2% | 1917.83 |
| Daily Fibonacci 61.8% | 1922.10 |
| Daily Pivot Point S1 | 1907.22 |
| Daily Pivot Point S2 | 1900.01 |
| Daily Pivot Point S3 | 1889.11 |
| Daily Pivot Point R1 | 1925.33 |
| Daily Pivot Point R2 | 1936.23 |
| Daily Pivot Point R3 | 1943.44 |
[/s2If]
Join Our Telegram Group
")


