#USDCHF @ 0.92631 remains sidelined inside one-month-old megaphone formation., @nehcap view: Limited downside expected (Pivot Orderbook analysis)
…
This is a premium post.
[s2If !current_user_can(access_s2member_level4)]Please register for PREMIUM VERSION HERE to read full post below containing analysis. In case of any error or you think you are not able to read the full post below, please email us at support#nehcap.com [lwa][/s2If] [s2If current_user_can(access_s2member_level4)]
- USD/CHF remains sidelined inside one-month-old megaphone formation.
- 21-DMA challenges recovery moves favored by Monday’s Doji candlestick.
- Sluggish RSI line signals more grinding but bullish MACD signals probe bears of late.
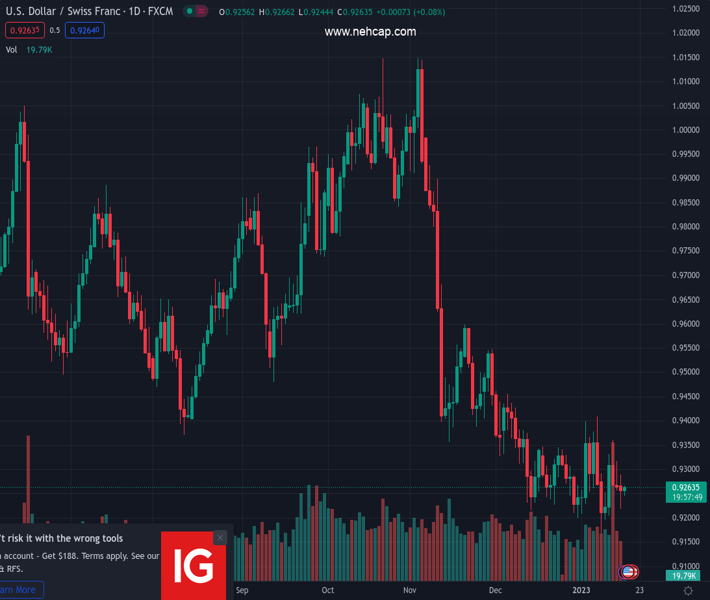
The pair currently trades last at 0.92631.
The previous day high was 0.9288 while the previous day low was 0.9219. The daily 38.2% Fib levels comes at 0.9262, expected to provide support. Similarly, the daily 61.8% fib level is at 0.9245, expected to provide support.
USD/CHF steadiness near 0.9260-65 as the Swiss Franc (CHF) traders struggle to justify the previous day’s Doji candlestick during early Tuesday. In doing so, the major currency pair remains inside a one-month-long megaphone trend-widening chart formation.
That said, the steady RSI (14) suggests further grinding of the USD/CHF prices but the bullish MACD signals challenge the pair buyers. Additionally probing the quote’s immediate upside is the 21-DMA resistance near 0.9285.
It should be noted that the stated megaphone’s top line, close to 0.9420 by the press time, appears a tough nut to crack for the USD/CHF bulls before retaking control.
Ahead of that, the November 2022 low near 0.9355 may probe the recovery moves past 0.9285.
Alternatively, the 0.9200 round figure and the monthly bottom around 0.9165 could restrict the short-term USD/CHF downside ahead of highlighting the stated trend-widening chart pattern’s lower line, close to 0.9145 at the latest.
In a case where the USD/CHF bears keep the reins past 0.9145, the 0.9100 round figure will precede the previous yearly low of 0.9091 to please them.
Overall, USD/CHF is likely to remain sideways even if the pair sellers appear to have run out of steam of late.
Trend: Limited downside expected
Technical Levels: Supports and Resistances
USDCHF currently trading at 0.9258 at the time of writing. Pair opened at 0.9263 and is trading with a change of -0.05% % .
| Overview | Overview.1 | |
|---|---|---|
| 0 | Today last price | 0.9258 |
| 1 | Today Daily Change | -0.0005 |
| 2 | Today Daily Change % | -0.05% |
| 3 | Today daily open | 0.9263 |
The pair remains strongly bearish on the daily time frame. It trades below the 20 SMA @ 0.9284, 50 SMA 0.9385, 100 SMA @ 0.962 and 200 SMA @ 0.9643.
| Trends | Trends.1 | |
|---|---|---|
| 0 | Daily SMA20 | 0.9284 |
| 1 | Daily SMA50 | 0.9385 |
| 2 | Daily SMA100 | 0.9620 |
| 3 | Daily SMA200 | 0.9643 |
The previous day high was 0.9288 while the previous day low was 0.9219. The daily 38.2% Fib levels comes at 0.9262, expected to provide support. Similarly, the daily 61.8% fib level is at 0.9245, expected to provide support.
Note the levels of interest below:
- Pivot support is noted at 0.9225, 0.9187, 0.9155
- Pivot resistance is noted at 0.9295, 0.9326, 0.9364
| Levels | Levels.1 |
|---|---|
| Previous Daily High | 0.9288 |
| Previous Daily Low | 0.9219 |
| Previous Weekly High | 0.9363 |
| Previous Weekly Low | 0.9167 |
| Previous Monthly High | 0.9471 |
| Previous Monthly Low | 0.9201 |
| Daily Fibonacci 38.2% | 0.9262 |
| Daily Fibonacci 61.8% | 0.9245 |
| Daily Pivot Point S1 | 0.9225 |
| Daily Pivot Point S2 | 0.9187 |
| Daily Pivot Point S3 | 0.9155 |
| Daily Pivot Point R1 | 0.9295 |
| Daily Pivot Point R2 | 0.9326 |
| Daily Pivot Point R3 | 0.9364 |
[/s2If]
Join Our Telegram Group
")


