WTI struggles for clear directions after the week-start pullback from two-week top. (Pivot Orderbook analysis)
…
This is a premium post.
[s2If !current_user_can(access_s2member_level4)]Please register for PREMIUM VERSION HERE to read full post below containing analysis. In case of any error or you think you are not able to read the full post below, please email us at support#nehcap.com [lwa][/s2If] [s2If current_user_can(access_s2member_level4)]
- WTI struggles for clear directions after the week-start pullback from two-week top.
- US Dollar weakness jostles with market’s cautious mood to probe Oil buyers.
- Hopes of China demand, UAE Energy Minister’s comments keep WTI bulls hopeful.
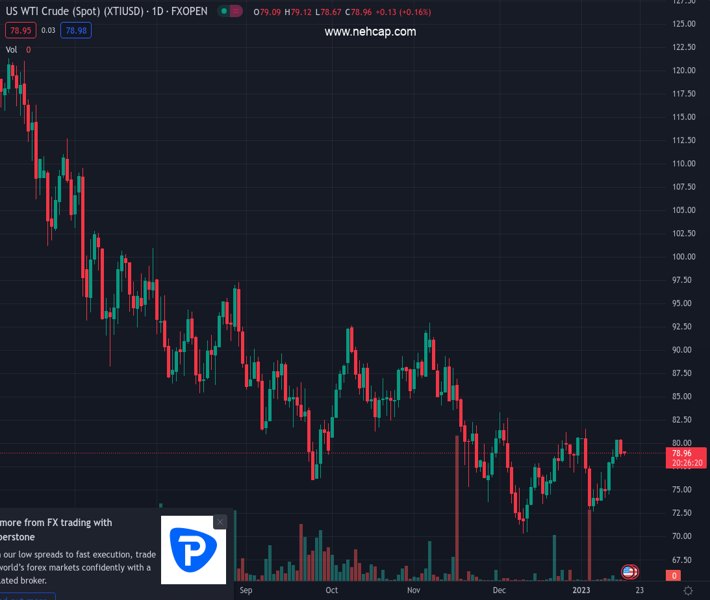
The pair currently trades last at 79.
The previous day high was 80.44 while the previous day low was 78.78. The daily 38.2% Fib levels comes at 79.42, expected to provide resistance. Similarly, the daily 61.8% fib level is at 79.81, expected to provide resistance.
WTI crude oil seesaws near $79.00 as energy traders await Chinese growth numbers during early Tuesday.
The black gold began the week’s trading on a negative note by reversing from the highest levels in two weeks as the US Dollar rebounds from a multi-month low despite the US holiday. However, the expectations of more Chinese energy demand and comments from the United Arab Emirates (UAE) Energy Minister seemed to have put a floor under the WTI crude oil prices.
US Dollar Index (DXY) fades bounce off the lowest levels since early June 2022, down 0.05% intraday near 102.30 by the press time, as the US Treasury bond yields retreat after an upside start to the week. That said, the benchmark US 10-year Treasury bond yields seesaw around 3.525% after extending the bounce off the one-month low the previous day. It’s worth noting that the two-year US bond coupons remain indecisive at around 4.25% by the press time.
Elsewhere, easing Covid restrictions allowed the world’s biggest oil consumer, China, to boost its energy import and favor WTI bulls. “China’s crude imports rose 4% year-on-year in December, and an expected resurgence in travel for the Lunar New Year holiday at the end of the week raised the outlook for demand for transportation fuels,” per Reuters.
It should be noted that UAE Energy Minister Suhail al-Mazrouei said on Monday that oil markets were balanced, per Reuters. The news also quotes the diplomat as citing an imbalance in the gas market.
Moving on, China’s Gross Domestic Product (GDP) for the fourth quarter (Q4), expected -0.8% QoQ versus 3.9% prior, will be crucial for energy traders to watch for clear directions. On the same line will be December month Industrial Production and Retail Sales data from the dragon nation. Should Beijing reports a positive surprise, the Oil price will have additional upside to track.
WTI crude oil remains on the bull’s radar unless breaking the 50-DMA support near $78.40. The recovery moves, however, need to cross the downward-sloping resistance line from December 01, 2022, close to $80.85, to restore buyer’s confidence.
Technical Levels: Supports and Resistances
XTIUSD currently trading at 79 at the time of writing. Pair opened at 79.12 and is trading with a change of -0.15% % .
| Overview | Overview.1 | |
|---|---|---|
| 0 | Today last price | 79 |
| 1 | Today Daily Change | -0.12 |
| 2 | Today Daily Change % | -0.15% |
| 3 | Today daily open | 79.12 |
The pair is trading above its 20 Daily moving average @ 77.71, above its 50 Daily moving average @ 78.6 , below its 100 Daily moving average @ 82.13 and below its 200 Daily moving average @ 92.38
| Trends | Trends.1 | |
|---|---|---|
| 0 | Daily SMA20 | 77.71 |
| 1 | Daily SMA50 | 78.60 |
| 2 | Daily SMA100 | 82.13 |
| 3 | Daily SMA200 | 92.38 |
The previous day high was 80.44 while the previous day low was 78.78. The daily 38.2% Fib levels comes at 79.42, expected to provide resistance. Similarly, the daily 61.8% fib level is at 79.81, expected to provide resistance.
Note the levels of interest below:
- Pivot support is noted at 78.46, 77.8, 76.81
- Pivot resistance is noted at 80.11, 81.1, 81.76
| Levels | Levels.1 |
|---|---|
| Previous Daily High | 80.44 |
| Previous Daily Low | 78.78 |
| Previous Weekly High | 80.25 |
| Previous Weekly Low | 73.89 |
| Previous Monthly High | 83.30 |
| Previous Monthly Low | 70.27 |
| Daily Fibonacci 38.2% | 79.42 |
| Daily Fibonacci 61.8% | 79.81 |
| Daily Pivot Point S1 | 78.46 |
| Daily Pivot Point S2 | 77.80 |
| Daily Pivot Point S3 | 76.81 |
| Daily Pivot Point R1 | 80.11 |
| Daily Pivot Point R2 | 81.10 |
| Daily Pivot Point R3 | 81.76 |
[/s2If]
Join Our Telegram Group
")


