#USDCHF @ 0.92573 has dropped as the risk-off impulse is losing strength. (Pivot Orderbook analysis)
…
This is a premium post.
[s2If !current_user_can(access_s2member_level4)]Please register for PREMIUM VERSION HERE to read full post below containing analysis. In case of any error or you think you are not able to read the full post below, please email us at support#nehcap.com [lwa][/s2If] [s2If current_user_can(access_s2member_level4)]
- USD/CHF has dropped as the risk-off impulse is losing strength.
- A full-blown recession in the US economy could trigger a 15-20% fall in S&P500.
- A meaningful decline in the US PPI might trim inflation projections further and will also weigh on wage growth ahead.
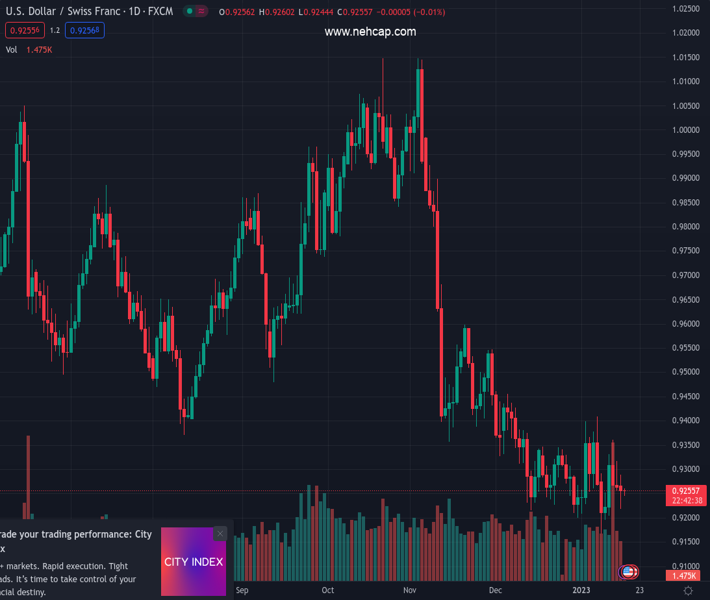
The pair currently trades last at 0.92573.
The previous day high was 0.9317 while the previous day low was 0.9256. The daily 38.2% Fib levels comes at 0.9279, expected to provide resistance. Similarly, the daily 61.8% fib level is at 0.9294, expected to provide resistance.
The USD/CHF pair has sensed selling pressure after failing to surpass the critical resistance of 0.9280 in the early Asian session. The Swiss franc asset has picked offers and has dropped to near 0.9240. It seems that the risk-off impulse is fading away as the United States markets will open today after a stretched weekend on account of Martin Luther King Jr. Day.
On Monday, the S&P500 futures witnessed a moderate fall amid holiday-inspired anxiety among the market participants. No doubt, the 500-stock basket is displaying signs of recovery from the past few weeks as the Federal Reserve (Fed) is expected to reach the terminal rates sooner and is looking to trim the pace of hiking interest rates. However, price stability could not be achieved without entering into a recession in the United States economy.
Economists at UBS think that the upcoming 4Q corporate reporting season will provide a reality check. “Earnings headwinds – an aggressive Fed, a normalization in demand for goods popular during the pandemic, a stronger USD, and higher costs because of more expensive labor – have become strong enough for us to expect no growth in S&P 500 4Q earnings per share compared to the same period last year. The downside risks remain elevated, and stocks could fall 15-20% if the economy enters a full-blown recession.”
The US Dollar Index (DXY) turned sideways around 102.00 after a firmer recovery move from the fresh seven-month low at 101.36. The USD Index is likely to be guided by the release of the US Producer Price Index (PPI) data, which is scheduled for Wednesday. A meaningful decline in the US PPI might trim inflation projections further and will also weigh on wage growth ahead.
Meanwhile, investors are awaiting the commentary from global officials at World Economic Forum, happening in the Swiss Franc region. On the economic front, the absence of major triggers in the economic calendar this week will keep the focus of investors on the US economic calendar for any action.
Technical Levels: Supports and Resistances
USDCHF currently trading at 0.9263 at the time of writing. Pair opened at 0.926 and is trading with a change of 0.03 % .
| Overview | Overview.1 | |
|---|---|---|
| 0 | Today last price | 0.9263 |
| 1 | Today Daily Change | 0.0003 |
| 2 | Today Daily Change % | 0.0300 |
| 3 | Today daily open | 0.9260 |
The pair remains strongly bearish on the daily time frame. It trades below the 20 SMA @ 0.9286, 50 SMA 0.9398, 100 SMA @ 0.9624 and 200 SMA @ 0.9643.
| Trends | Trends.1 | |
|---|---|---|
| 0 | Daily SMA20 | 0.9286 |
| 1 | Daily SMA50 | 0.9398 |
| 2 | Daily SMA100 | 0.9624 |
| 3 | Daily SMA200 | 0.9643 |
The previous day high was 0.9317 while the previous day low was 0.9256. The daily 38.2% Fib levels comes at 0.9279, expected to provide resistance. Similarly, the daily 61.8% fib level is at 0.9294, expected to provide resistance.
Note the levels of interest below:
- Pivot support is noted at 0.9238, 0.9217, 0.9178
- Pivot resistance is noted at 0.9299, 0.9338, 0.936
| Levels | Levels.1 |
|---|---|
| Previous Daily High | 0.9317 |
| Previous Daily Low | 0.9256 |
| Previous Weekly High | 0.9363 |
| Previous Weekly Low | 0.9167 |
| Previous Monthly High | 0.9471 |
| Previous Monthly Low | 0.9201 |
| Daily Fibonacci 38.2% | 0.9279 |
| Daily Fibonacci 61.8% | 0.9294 |
| Daily Pivot Point S1 | 0.9238 |
| Daily Pivot Point S2 | 0.9217 |
| Daily Pivot Point S3 | 0.9178 |
| Daily Pivot Point R1 | 0.9299 |
| Daily Pivot Point R2 | 0.9338 |
| Daily Pivot Point R3 | 0.9360 |
[/s2If]
Join Our Telegram Group
")


