#GBPUSD @ 1.21975 The absence of follow-up buying after a corrective move indicates a lack of strength in the Pound Sterling. (Pivot Orderbook analysis)
…
This is a premium post.
[s2If !current_user_can(access_s2member_level4)]Please register for PREMIUM VERSION HERE to read full post below containing analysis. In case of any error or you think you are not able to read the full post below, please email us at support#nehcap.com [lwa][/s2If] [s2If current_user_can(access_s2member_level4)]
- The absence of follow-up buying after a corrective move indicates a lack of strength in the Pound Sterling.
- A recovery move in the US Dollar Index has been recorded amid a decline in investors’ risk appetite.
- The 20-and 50-period EMAs are on the verge of delivering a bear cross around 1.2200.
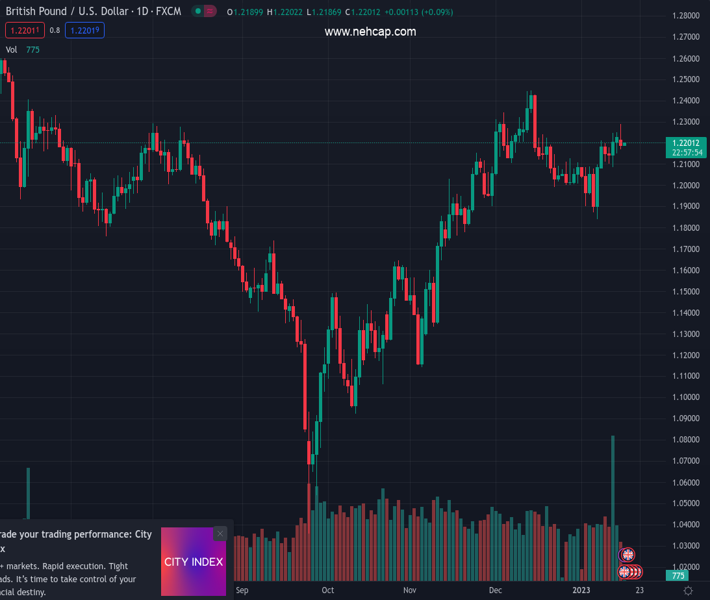
The pair currently trades last at 1.21975.
The previous day high was 1.2249 while the previous day low was 1.2151. The daily 38.2% Fib levels comes at 1.2211, expected to provide resistance. Similarly, the daily 61.8% fib level is at 1.2188, expected to provide support.
The GBP/USD pair is displaying a lackluster performance as the auction profile has trimmed to a narrow range of 1.2180-1.2210 in the early Tokyo session. Earlier, the Cable witnessed a steep fall after failing to hit the critical resistance of 1.2300. A sell-off in Cable was triggered due to a sheer recovery move by the US Dollar Index (DXY).
A corrective move in the S&P500 futures on Monday as caution soars in market sentiment ahead of the United States Producer Price Index (PPI) data, triggered a risk-aversion theme. Also, the speech from Bank of England (BoE) Governor Andrew Bailey citing weaker inflation projections failed to provide support to the Pound Sterling.
On an hourly scale, a failure by Pound Sterling in keeping the Cable above the horizontal resistance plotted around January 12 high at 1.2243, signaled a loss in the upside momentum. Also, chances of further weakness in the major are solid amid an absence of follow-up buying despite finding an immediate cushion at around 1.2175.
The 20-and 50-period Exponential Moving Averages (EMAs) are on the verge of delivering a bearish crossover of around 1.2205, which would be added to the downside filters.
Meanwhile, the Relative Strength Index (RSI) (14) is oscillating in a 40.00-60.00 range, which indicates that investors are awaiting a fresh trigger for a decisive move.
The Cable will display a sheer downside if it drops below Monday’s low at 1.2171 as it will drag the major toward January 11 low at 1.2100 followed by the psychological support at 1.2000.
On the flip side, a confident break above Monday’s high at 1.2285 will drive the asset toward December 5 high at 1.2344. A breach of the latter will expose the asset for to re-test a seven-month high at 1.2447.
Technical Levels: Supports and Resistances
GBPUSD currently trading at 1.2197 at the time of writing. Pair opened at 1.2234 and is trading with a change of -0.3 % .
| Overview | Overview.1 | |
|---|---|---|
| 0 | Today last price | 1.2197 |
| 1 | Today Daily Change | -0.0037 |
| 2 | Today Daily Change % | -0.3000 |
| 3 | Today daily open | 1.2234 |
The pair remains strongly bullish on the daily timeframe. It trades above its 20 SMA @ 1.2088, 50 SMA 1.2038, 100 SMA @ 1.1688 and 200 SMA @ 1.1997.
| Trends | Trends.1 | |
|---|---|---|
| 0 | Daily SMA20 | 1.2088 |
| 1 | Daily SMA50 | 1.2038 |
| 2 | Daily SMA100 | 1.1688 |
| 3 | Daily SMA200 | 1.1997 |
The previous day high was 1.2249 while the previous day low was 1.2151. The daily 38.2% Fib levels comes at 1.2211, expected to provide resistance. Similarly, the daily 61.8% fib level is at 1.2188, expected to provide support.
Note the levels of interest below:
- Pivot support is noted at 1.2174, 1.2113, 1.2076
- Pivot resistance is noted at 1.2272, 1.2309, 1.237
| Levels | Levels.1 |
|---|---|
| Previous Daily High | 1.2249 |
| Previous Daily Low | 1.2151 |
| Previous Weekly High | 1.2249 |
| Previous Weekly Low | 1.2086 |
| Previous Monthly High | 1.2447 |
| Previous Monthly Low | 1.1992 |
| Daily Fibonacci 38.2% | 1.2211 |
| Daily Fibonacci 61.8% | 1.2188 |
| Daily Pivot Point S1 | 1.2174 |
| Daily Pivot Point S2 | 1.2113 |
| Daily Pivot Point S3 | 1.2076 |
| Daily Pivot Point R1 | 1.2272 |
| Daily Pivot Point R2 | 1.2309 |
| Daily Pivot Point R3 | 1.2370 |
[/s2If]
Join Our Telegram Group
")


