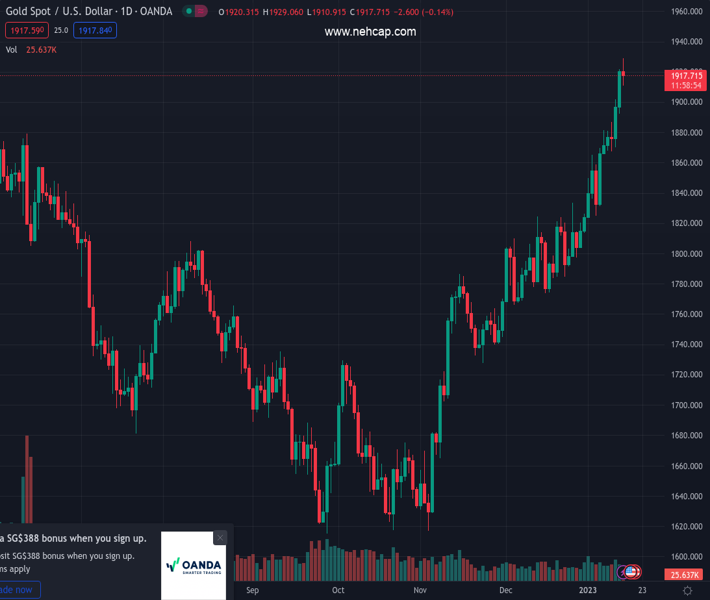
#XAUUSD @ 1,917.35 Gold price corrects from a fresh multi-month top touched earlier this Monday. (Pivot Orderbook analysis)
…
This is a premium post.
[s2If !current_user_can(access_s2member_level4)]Please register for PREMIUM VERSION HERE to read full post below containing analysis. In case of any error or you think you are not able to read the full post below, please email us at support#nehcap.com [lwa][/s2If] [s2If current_user_can(access_s2member_level4)]
- Gold price corrects from a fresh multi-month top touched earlier this Monday.
- A goodish intraday US Dollar recovery drives flow away from the XAU/USD.
- The downside remains cushioned amid bets for smaller rate hikes by the Fed.
The pair currently trades last at 1917.35.
The previous day high was 1921.96 while the previous day low was 1892.34. The daily 38.2% Fib levels comes at 1910.65, expected to provide support. Similarly, the daily 61.8% fib level is at 1903.65, expected to provide support.
Gold price retreats from a nearly nine-month peak, around the $1,929 area touched earlier this Monday and remains depressed through the first half of the European session. The XAU/USD drops to a fresh daily low, around the $1,910 region in the last hour, though any subsequent slide could be seen as a buying opportunity and remain limited.
The US Dollar (USD) stalls its recent downtrend and stages a solid intraday recovery from a seven-month low. This, in turn, is seen as a key factor weighing on the US Dollar-denominated Gold price. That said, growing acceptance that the Federal Reserve (Fed) will soften its hawkish stance, amid signs of easing inflationary pressures, could cap any meaningful upside for the Greenback.
In fact, the latest inflation figures released from the United States (US) showed that consumer prices fell in December for the first time in more than two and half years. Moreover, several Fed officials backed the case for smaller rate hikes and reaffirmed bets for a 25 lift-off in February. This, in turn, might keep the US Treasury bond yields depressed and act as a headwind for the USD.
Furthermore, speculations that the US central bank may be nearing the end of its current rate-hiking cycle could lend some support to the non-yielding Gold price. Apart from this, a softer risk tone – as depicted by a weaker trading sentiment around the equity markets – should hold back traders from placing aggressive bearish bets around the safe-haven XAU/USD and help limit the downside.
Investors remain concerned about headwinds stemming from the worst COVID-19 outbreak in China. Adding to this, the protracted Russia-Ukraine war has been fueling worries about a deeper global economic downturn and capping any optimism in the markets. This makes it prudent to wait for strong follow-through selling before confirming that the Gold price has topped out in the near term.
From a technical perspective, pullback below the $1,900 round-figure mark is more likely to attract fresh buyers and remain limited near the $1,885-$1,880 region. The latter should act as a strong base for the Gold price, which if broken decisively might prompt some technical selling and pave the way for a deeper corrective decline. On the flip side, the multi-month high, around the $1,929 zone, now seems to act as an immediate resistance. Some follow-through buying has the potential to lift the XAU/USD further towards the next relevant barrier near the $1,948-$1,950 area.
Technical Levels: Supports and Resistances
XAUUSD currently trading at 1917.15 at the time of writing. Pair opened at 1920.76 and is trading with a change of -0.19 % .
| Overview | Overview.1 | |
|---|---|---|
| 0 | Today last price | 1917.15 |
| 1 | Today Daily Change | -3.61 |
| 2 | Today Daily Change % | -0.19 |
| 3 | Today daily open | 1920.76 |
The pair remains strongly bullish on the daily timeframe. It trades above its 20 SMA @ 1836.21, 50 SMA 1793.04, 100 SMA @ 1734.08 and 200 SMA @ 1777.12.
| Trends | Trends.1 | |
|---|---|---|
| 0 | Daily SMA20 | 1836.21 |
| 1 | Daily SMA50 | 1793.04 |
| 2 | Daily SMA100 | 1734.08 |
| 3 | Daily SMA200 | 1777.12 |
The previous day high was 1921.96 while the previous day low was 1892.34. The daily 38.2% Fib levels comes at 1910.65, expected to provide support. Similarly, the daily 61.8% fib level is at 1903.65, expected to provide support.
Note the levels of interest below:
- Pivot support is noted at 1901.41, 1882.07, 1871.79
- Pivot resistance is noted at 1931.03, 1941.31, 1960.65
| Levels | Levels.1 |
|---|---|
| Previous Daily High | 1921.96 |
| Previous Daily Low | 1892.34 |
| Previous Weekly High | 1921.96 |
| Previous Weekly Low | 1865.22 |
| Previous Monthly High | 1833.38 |
| Previous Monthly Low | 1765.89 |
| Daily Fibonacci 38.2% | 1910.65 |
| Daily Fibonacci 61.8% | 1903.65 |
| Daily Pivot Point S1 | 1901.41 |
| Daily Pivot Point S2 | 1882.07 |
| Daily Pivot Point S3 | 1871.79 |
| Daily Pivot Point R1 | 1931.03 |
| Daily Pivot Point R2 | 1941.31 |
| Daily Pivot Point R3 | 1960.65 |
[/s2If]
Join Our Telegram Group
")


